

SUMMARY
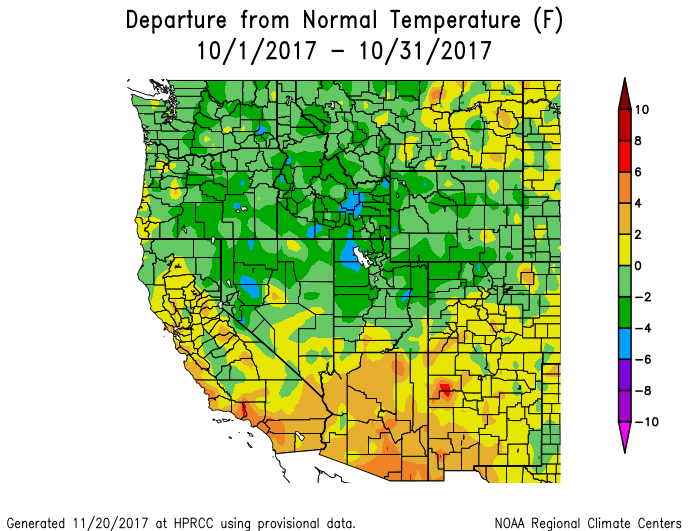
Going into Water Year 2018 there was some serious portents due to moderate La Nina conditions combined with, or because of, a strong low pressure in the east and a strong ridge near the West Coast creating a high amplitude “blocking pattern”, which usually result in extended periods of dry/warm or cold/wet conditions. For Colorado, it mostly meant dry/warm with storm tracks being routed north of Colorado. The result was the season starting out slow, or close to non-existent, with no winter storms observed at Red Mountain Pass by the end of December. By the end of January we saw 3 storms when normally we receive a cumulative total of 12 storms by this time-frame. February was closer to an average month in terms of precipitation statewide and at Red Mt we documented 5 storms (average for the month is 3.4). March was dismal for most of Colorado except for possibly the Yampa/White Basin which was 85% of normal. April continued the trend in the southern half of the state but was closer to average in the Colorado Mainstem, Yampa, and Gunnison. After a productive storm May 1-2, we observed no precipitation for 16 days, then it was only 0.3” over a two day period. Going into May, and immediately following the May 1-2 storm, conditions were ripe for an early and fast snowmelt season; a shallow snowpack, high end of average dust conditions, and warm/sunny conditions all led to snow ablation 5-7 weeks earlier than normal. With only the one storm the month of May along with rapid melt of a shallow snowpack, by the end of the month snow covered area was only ~7%, essentially full ablation. We observed no winter storms the month of June. At the end of the winter season we documented 15 winter storms compared to a period of record average of 25. These winter storm reports can be viewed at the snowstudies.org website.
At the Center for Snow and Avalanche Studies’ (CSAS) Senator Beck Basin Study Area (SBB) located at Red Mountain Pass, the primary Colorado Dust-on-Snow Program (CODOS) monitoring site, WY2018 produced a total of eight separate dust-on-snow events, about average in terms of number of events, and also in terms of total dust loading based on observations going back to WY2005. The dust season began relatively late in the season since the lack of storm opportunities also meant reduced chances to receive dust-on-snow (DOS) events. But with the Southwest gradually digging its way into an exceptional drought, it was only a matter of time before eventual storms would track through the source region and bring dust to the Colorado snowpack.
Dust-on-snow events occurred on December 21, February 18-19, March 25, April 1-3, April 12, April 17, April 19, and May 12. The first event (D1) was inconsequential since it was deposited on the basal layer of the snowpack. D2, occurring on February 18-19 was about 30” above the ground by springtime and was of moderate intensity, a very noticeable layer in the snowpack. D3 was light and deposited March 25 as a dry event, without precipitation, on the surface of the snow. D4 was another dry event deposited directly onto D3 from April 1-3. It was slightly stronger than D3, and the two layers combined were very evident on/in the snowpack at SASP. D5 was a major dry event, arriving with high winds on April 12 and fell on top of D3/D4 which were mostly on the surface of the snow, combining these three dust layers. After D5 was deposited, D3/D4/D5 were immediately buried by ~9” of snow accumulation at SASP. Both D6 and D7 were of light intensity but since they immediately merged once D7 was deposited it made for a heavy-moderate layer. Events D3 thru D7 occurred near peak snow accumulation and played a consequential role in snowmelt for essentially the entire melt season, which occurred ~ 1 month early and played out quickly especially in Southern Colorado. By latter April, D3-D7 were fully merged at the surface of the snow and by early May D2 had also merged with these surface layers.
We classified dust severity as “High End of Average” in SBB. All layers made for a very dirty dust-on-snow season but not quite enough to be a “Maximum” dust loading year. Besides Grand Mesa which was also considered “High End of Average”, Northern and Central CODOS sample sites in Colorado were classified as “Average” dust severity.
This Season Summary will often reference or link to snowpack, streamflow, weather, and climate products generated by the NRCS SNOTEL program, USGS National Water Information System, and NOAA National Weather Service and Climate Prediction Center respectively, as presented and archived on CODOS monitoring site webpages.
MONTHLY WEATHER CONDITIONS
October-December Weather Summary
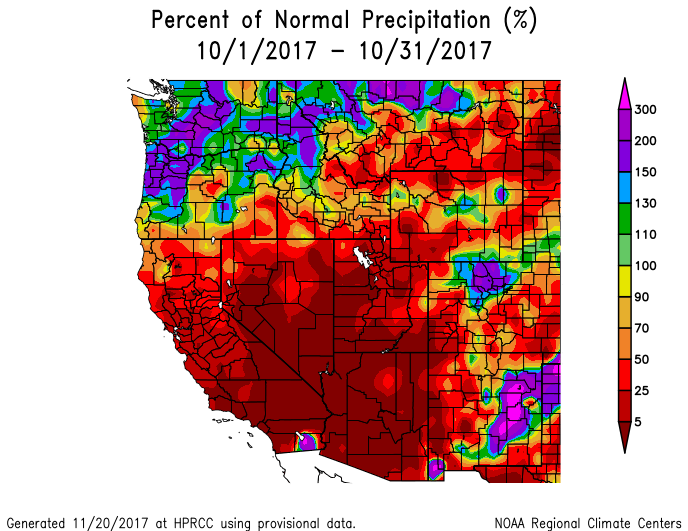
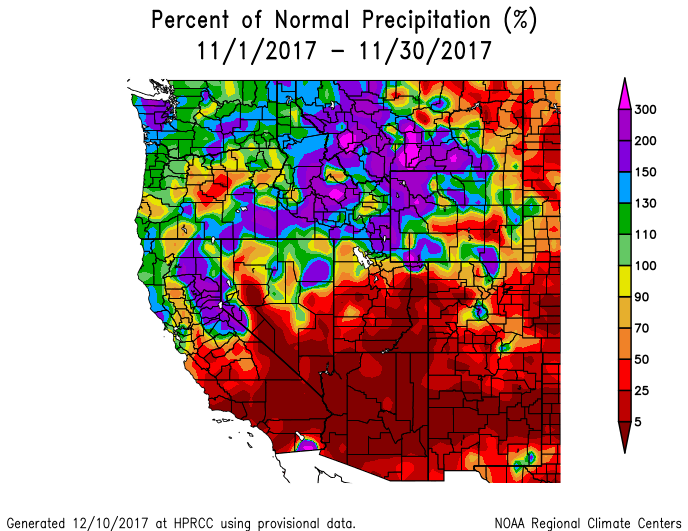
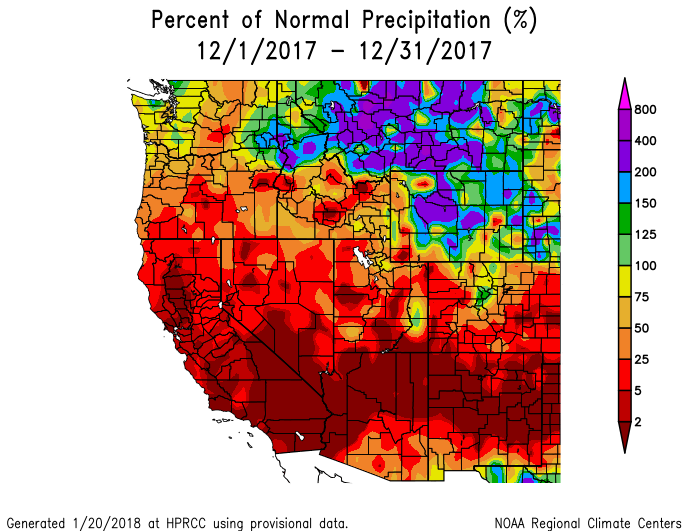
The fall saw minimal snowpack building with more rain than snow at the Swamp Angel Study Plot. October was the first October on our record with no snow (we received 1.7” (44 mm) of precipitation total, all as rain). November and December were both the driest on our record overall with 0.7” (17 mm) and 0.83” (21 mm) of precipitation respectively. On average the Senator Beck Basin receives 8 winter storm events during this three month period, this season we received none, making this year our latest to start winter on record. The small amount of snow which did fall during these months was subject to heavy metamorphism, becoming large facets before being buried fully in January. On December 21 we received a minor dust event, noticeable only after weeks of metamorphosing with the basal snow layer. But since this dust was located at the base of the snowpack it was inconsequential influencing spring snowmelt.
January Weather Summary
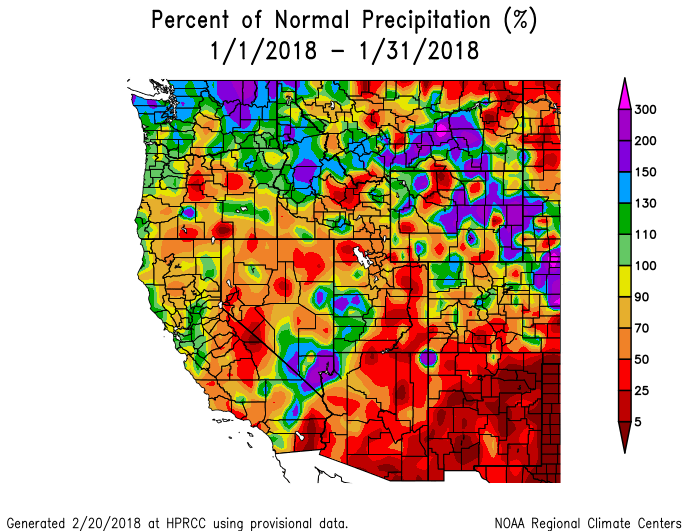
In January the San Juan Mountains finally started to build the winter snowpack. There were three winter storms during the month, the first of the season to meet CSAS criteria to be classified as winter storms. The heavily metamorphosed early season snow, which had been sitting exposed to primarily clear and dry weather, was buried, creating a layer of basal facets which persisted through the rest of the winter. Total precipitation was 3.9” (99 mm), below the monthly average of 4.6” (118 mm), which brought the year-to-date precipitation to 7.1” (181 mm) (the water year begins October 1). This year-to-date total was a miserable 41% of average for that date, 17.4” (442 mm) is the CSAS average for WY2004 thru WY2017. Once again, the San Juan’s remained dust free for the month of January, continuing the perfect record of never having a January dust storm in our period of record.
February Weather Summary
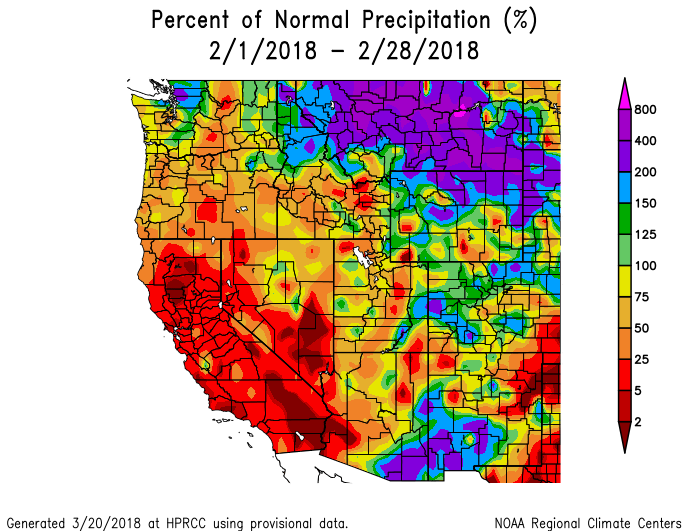
For the first month of the winter season, February saw above average precipitation with 4.9” (125 mm) of water making it 113% of the CSAS average. We received 5 winter storms by CSAS criteria. None of these were major drought busting events, but the consistent snowfall made February our most significant snowpack-building month of the year. We ended February with 12” (306 mm) of year-to-date precipitation, which is 57% of average for that date. While this number is still distressingly low, it was a welcome uptick from the end of January a month prior. On February 18th the San Juans also received the first notable dust event of the season. D2 was a wet event which was very diffuse within new snow. The layer became far more visible as the snow settled throughout the remainder of the season.
March Weather Summary
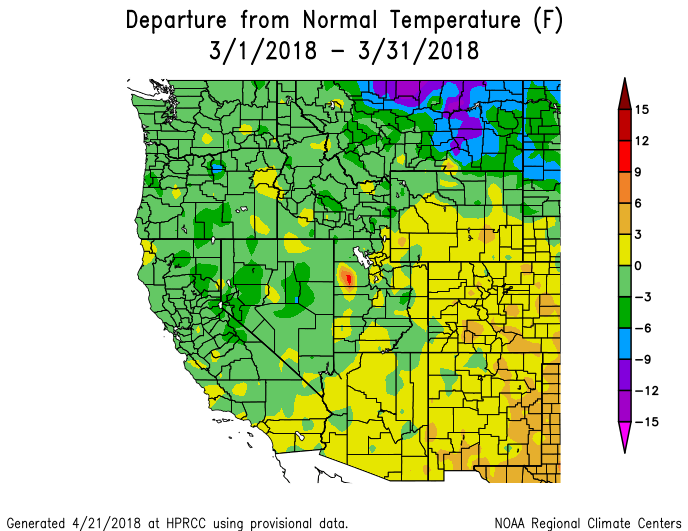
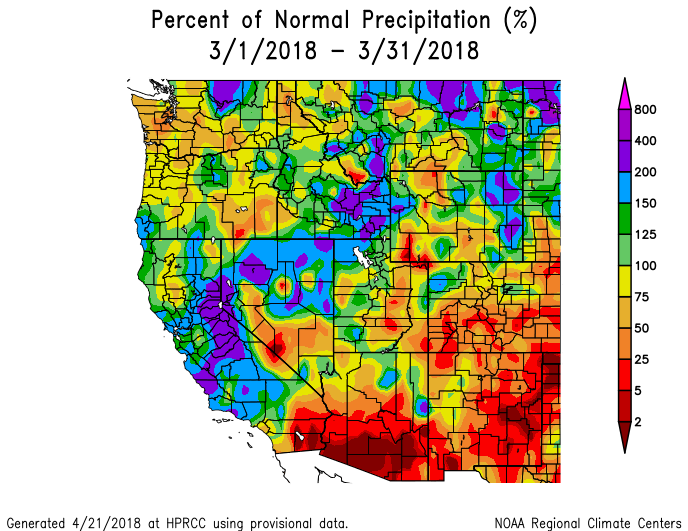
March saw only three more storms in the San Juans with just 2.6” (65 mm) of precipitation at Swamp Angel, 63% of our March average. March was also warm, with long stretches of warm sunny weather between storms, especially during the first half of the month when we received almost no precipitation. Still, the snowpack continued to increase, although only moderately. The San Juans saw the third dust event of the season on March 25-26, which was the most significant dust loading event up to this point. March ended with 14.6” (371 mm) of cumulative water year precipitation, which is only 58% of average for the date, maintaining the low cumulative snowpack that characterized the entire season.
April Weather Summary
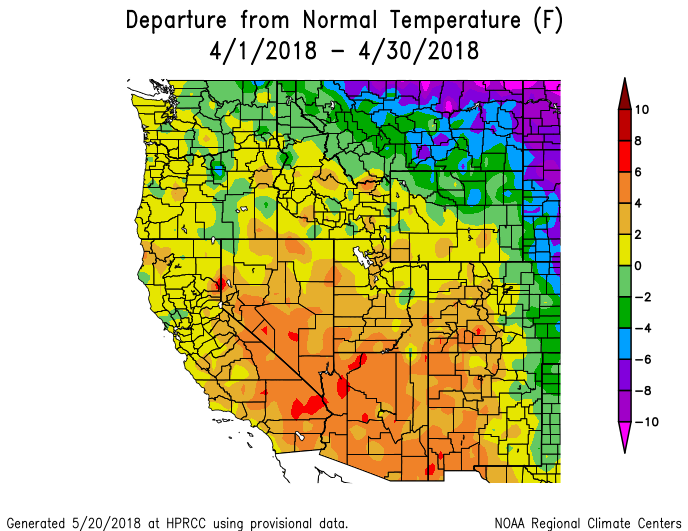
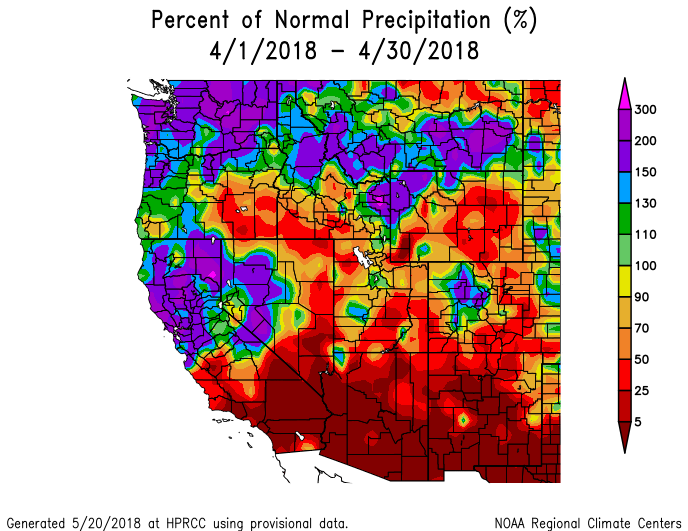
After February, April was our second biggest month for precipitation of the winter. With 4.4” (112 mm) of precipitation we received 93% of average precipitation for the month. April was yet another warm month, resulting in more than an average amount of precipitation falling as rain (estimated 0.6” (16 mm)). We only received 3 winter storms during the month, as well as other scattered smaller amounts of precipitation, which we saw on 15 of the 30 days of the month at the Swamp Angel Study Plot. We also had our biggest dust month of the year. Four events, with two of them bringing a significant dust load, were recorded in the Senator Beck Basin. Several events were dry and remained on the surface, accelerating snowmelt. Additionally, snowpack at Swamp Angel was isothermal early in the month and was ripe for melting when temperatures were warm and dust was on the surface. All of this came together to see notable snowpack losses throughout the month, despite having the second most precipitation of any month this year. April ended with 19” (483 mm) of cumulative water year precipitation, which is just 64% of average for the date, and continuing the low snow year we have been experiencing all season.
May Weather Summary
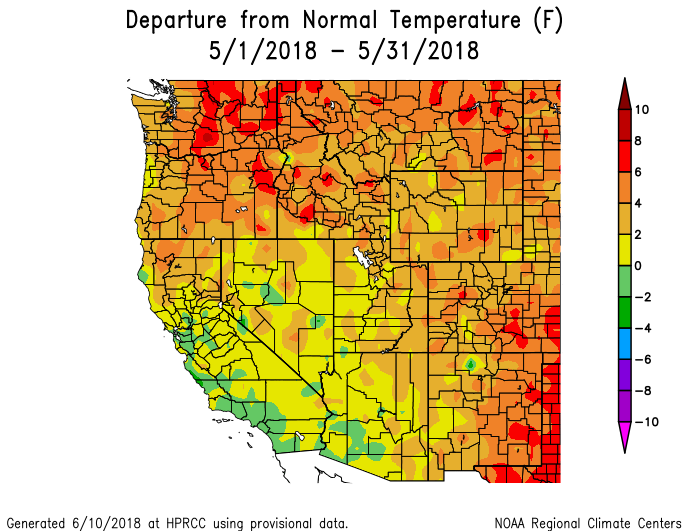
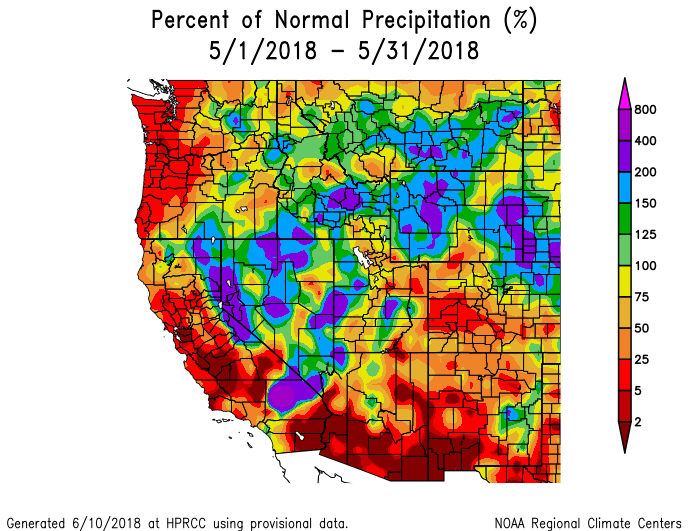
After a productive storm May 1-2, we observed no precipitation for 16 days, then it was only 0.3” over a couple days. Leading up to and immediately following the May 1-2 storm, conditions were ripe for an early and fast snowmelt season; a shallow snowpack, high-average dust conditions, and hot/sunny conditions all led to snow ablation 5-7 weeks earlier than normal – snow was gone at SASP on May 16 and May 23 at SBSP. With only the one storm the month of May, by the end of the month snow covered area was only ~7%, essentially full ablation.
June Weather Summary
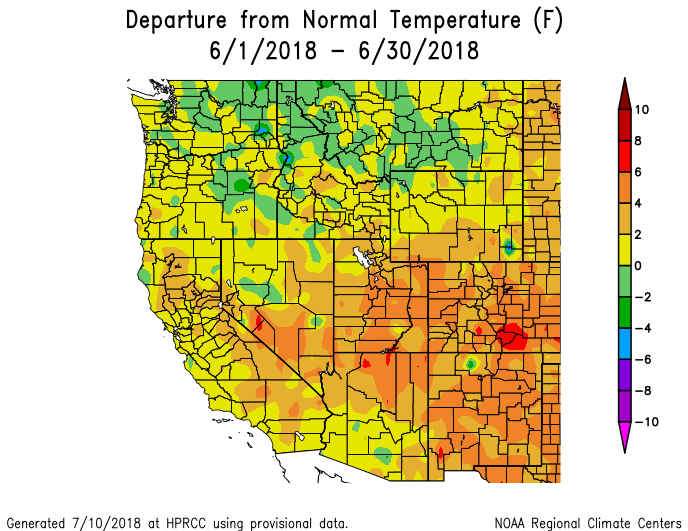
Most of June was dominated by a persistent ridge of high pressure that locked the San Juan Mountains into hot and dry conditions. Air temperatures in Western Colorado were 3-7 degrees above normal, making June the 3rd warmest on record. Regions in Southern Colorado, like the Sangre de Cristo and San Juan Mountains, saw the warmest January-June period on record. We observed no winter storms and only three days of precipitation totaling 0.51” at SBB, with 0.47” of that coming on June 16-17. June is historically a dry month (average June precipitation is around 1.2”), nonetheless these long dry spells did not help with the 416 Fire that started the first of the month north of Durango, which is turning out to be one of Colorado’s largest in history.

SENATOR BECK STUDY BASIN DATA
This section describes conditions and data collected by the Center for Snow and Avalanche Studies at our Senator Beck Basin Study Area (SBB) at Red Mountain Pass under our Mountain System Monitoring program, which includes the CODOS program. At SBB, snowpack, weather, soils, and radiation conditions are monitored and measured at the well-sheltered subalpine Swamp Angel Study Plot (SASP, 11,060’) and at the more exposed, alpine Senator Beck Study Plot (SBSP, 12,180’). Nearby, wind speed, wind direction, air temperature, and humidity data are collected at the Putney Study Plot (PTSP, 12,323’), located to minimize the influence of local terrain on those measurements. Finally, SBB streamflow discharge is continuously measured at the SBB pour point at the Senator Beck Stream Gauge (SBSG, 11,030’), in a broad-crested, notched weir.
In terms of snowpack, snow profiles (where we collect SWE, grain type/size, density, layers, and dust information) are conducted every 5-10 days at SASP and as often as possible at SBSP. In addition, both SASP and SBSP stations are equipped with an automated SR50 snow depth sensor.

The winter did not really start until well into after the first week of January, that is when we recorded our first winter storm of the season. By the end of January we had received 3 winter storms, the average is 12. We documented a total of 15 winter storms the 2017/18 season with an average in our period of record of 25.

The above graph shows precipitation with snow depth at SASP and SBSP. February and April were the only near average months in terms of precipitation, with 113% and 93%, respectively. November and December were our driest on record. The rest of the winter months were well below average.

Water Year 2018 cumulative precipitation, through the month of June, is currently 61% of our period of record average.

Air temperature at Putney station.

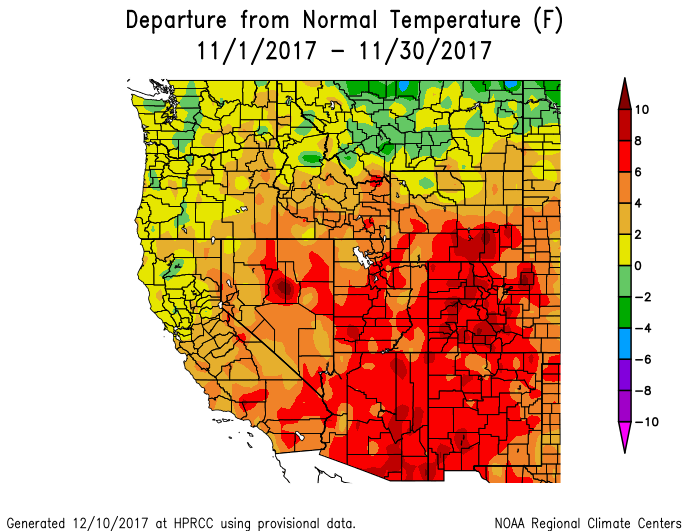
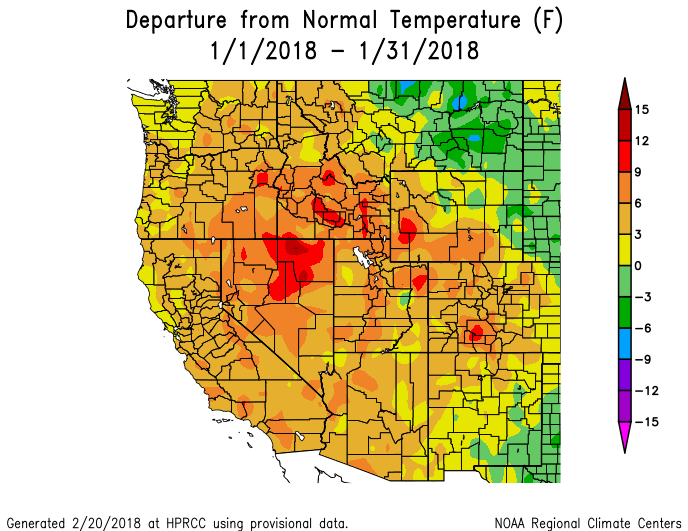
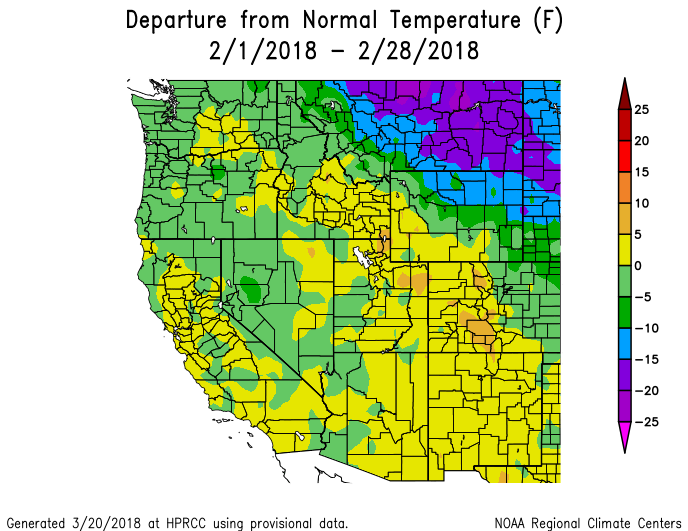
What is becoming common, extended periods of warmer air temperatures was the norm this winter, while colder than average temperatures tended to be short lived. It is becoming difficult to stay up on records broken. Statewide, we experienced our 3rd warmest June. 2nd warmest May. Warmest November on record. October-December was the warmest on record. And the January-June period was the warmest on record for many areas of Southern Colorado.
SNOWPACK CONDITIONS
The 2017/2018 snow season was almost doomed from the start with a strong blocking pattern routing storm tracks north and locking in extensive dry/warm conditions for Colorado. The 2017/18 snow season was typical of the last few years in the sense that percent of normal SWE took on a north/south gradient, where Northern Colorado received closer to average SWE (or above) while the southern mountains typically receiving less percent of normal.
Particularly for the southern half of the state the snowpack did not begin actually forming until January and then only slightly. February was encouraging with above average accumulation (113%) in the Southern Basins and steady accumulation in the more northerly Northern Basins. We needed another month or two of these high accumulation rates to make up for such a slow start to the season, but March didn’t result in any real gain in snowpack for the Gunnison Basin and towards the south. Modest, steady gains were seen in Northern Colorado. April was another encouraging month especially after receiving 1.7” (43 mm) precipitation April 6-8. But the month ended up near average at 93% at Swamp Angel. Unfortunately, May was essentially the end of winter. Actually, this was the first year in the last five where we have not seen a mostly wetter and cooler month of May. After a storm May 1-2 that brought ~1” of precipitation, our last winter storm of winter, warm and dry conditions prevailed. From April 23 – June 15 Swamp Angel received only 1.7” (42 mm) precipitation, with 1” (24 mm) of that being the May 1-2 storm. During the same time-frame, average daily air temperatures were above average, except during the May 1-2 storm.
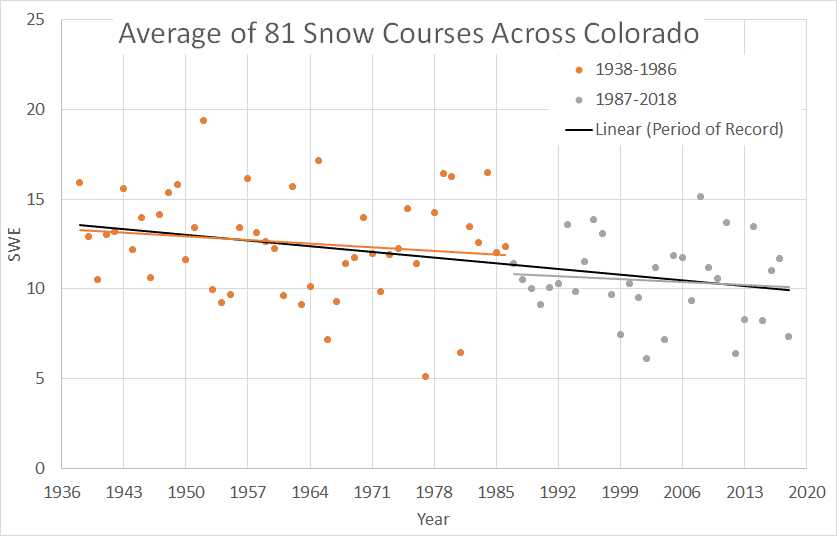
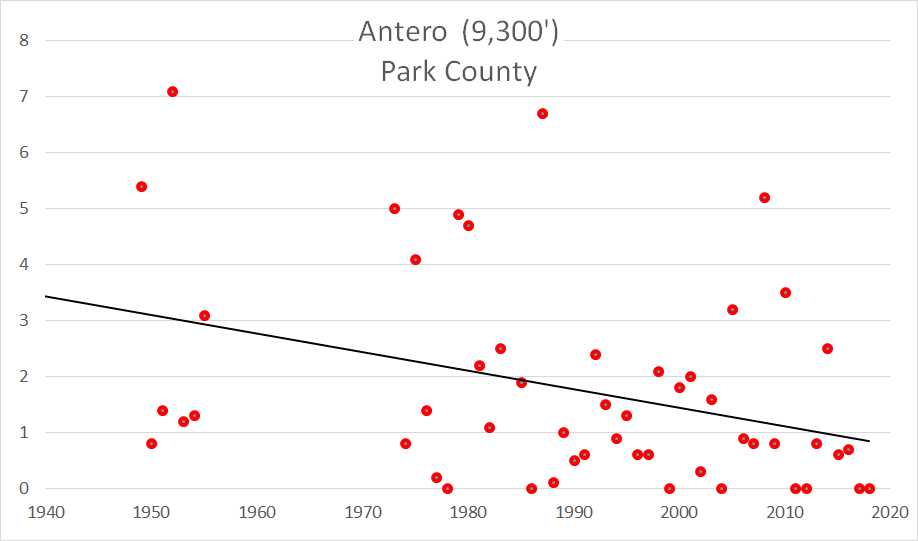
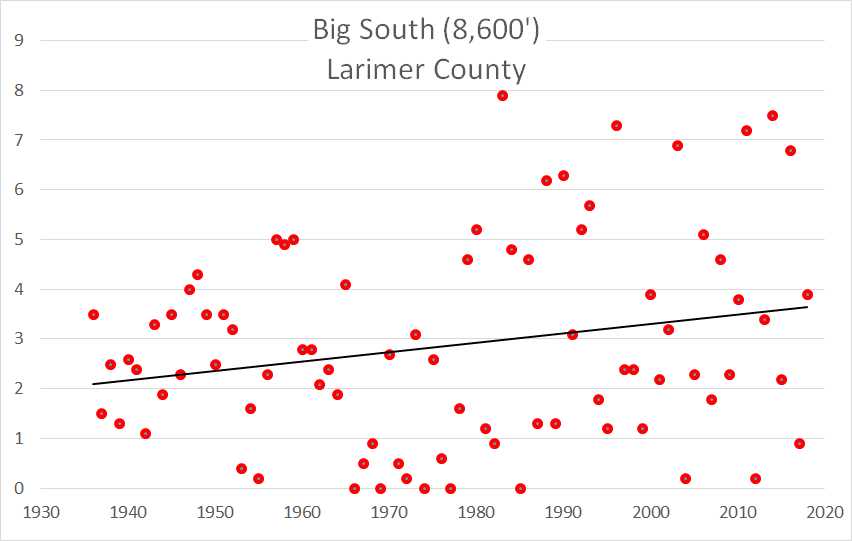
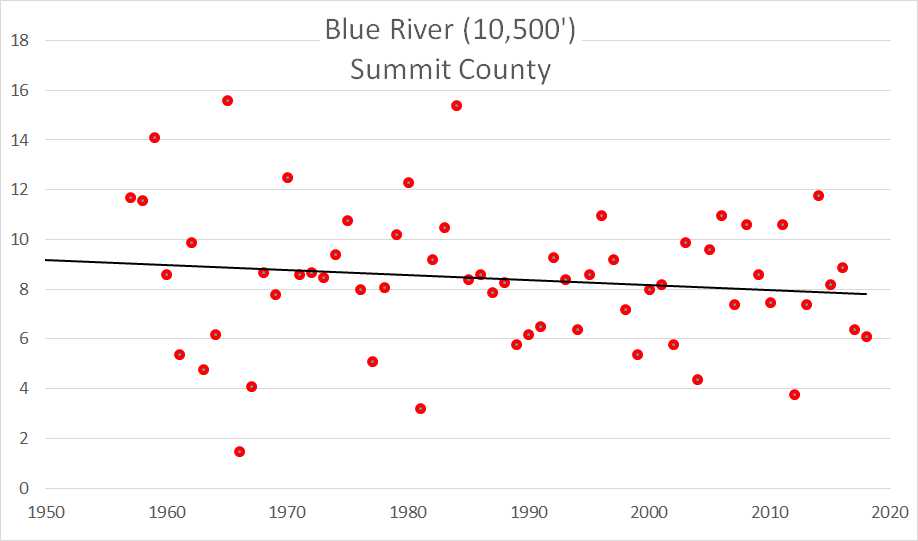
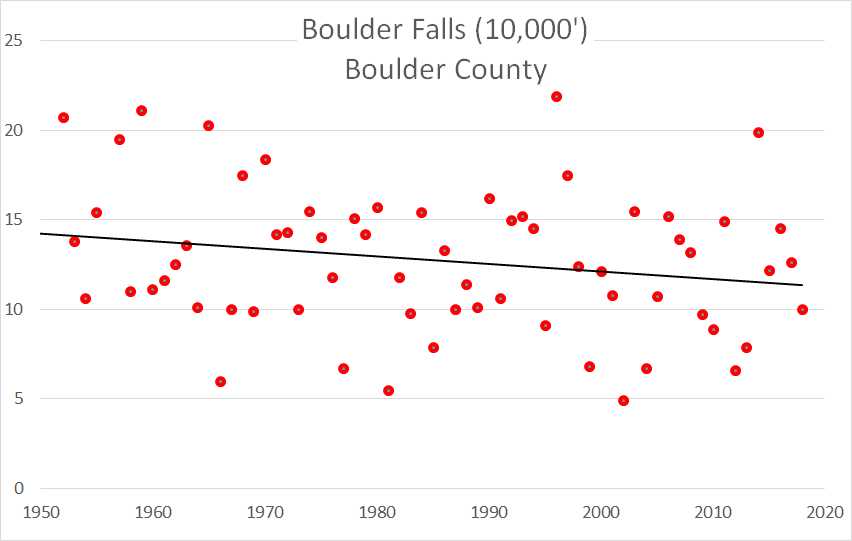
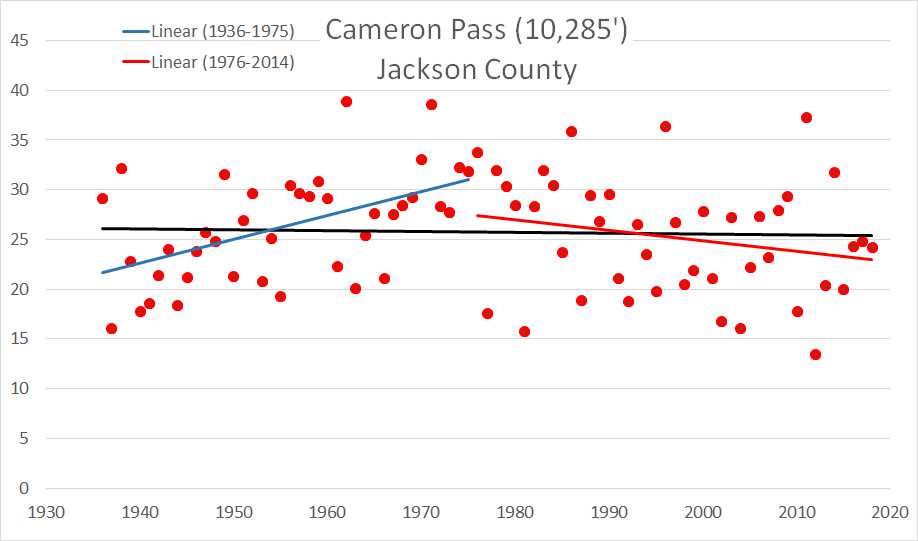
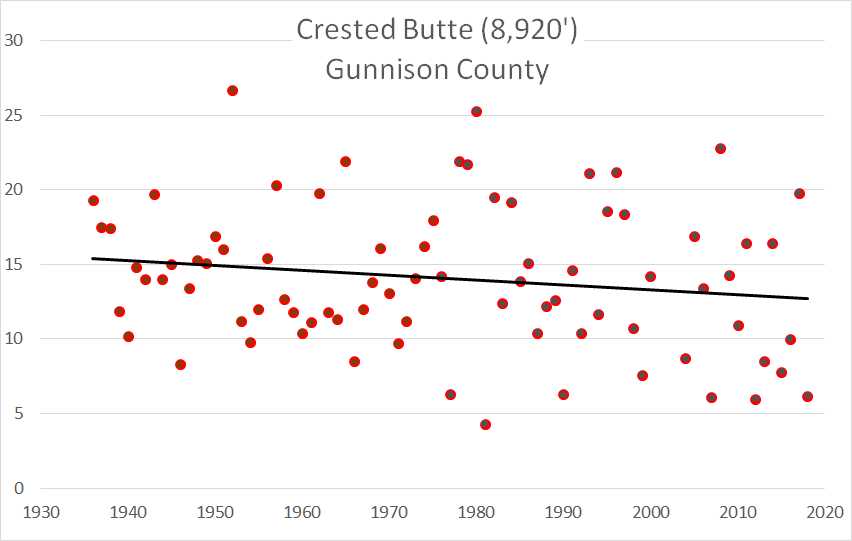
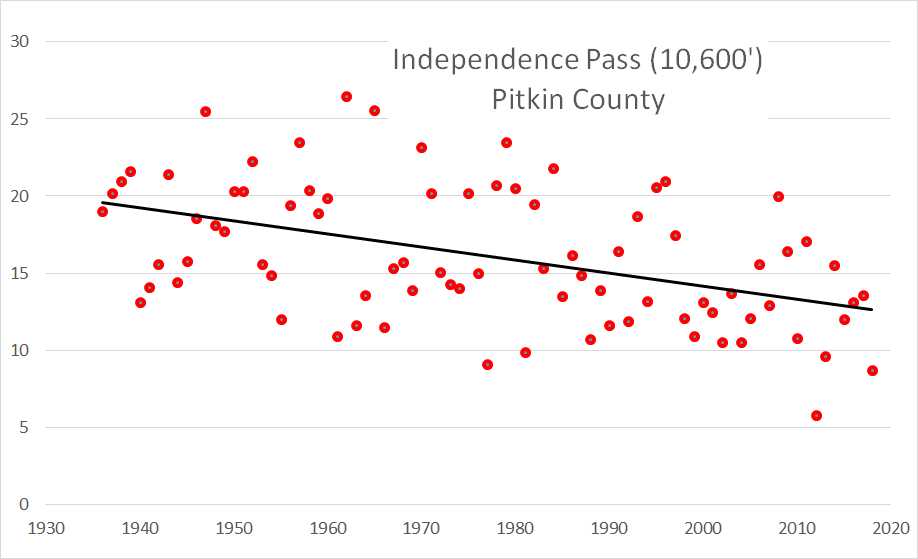
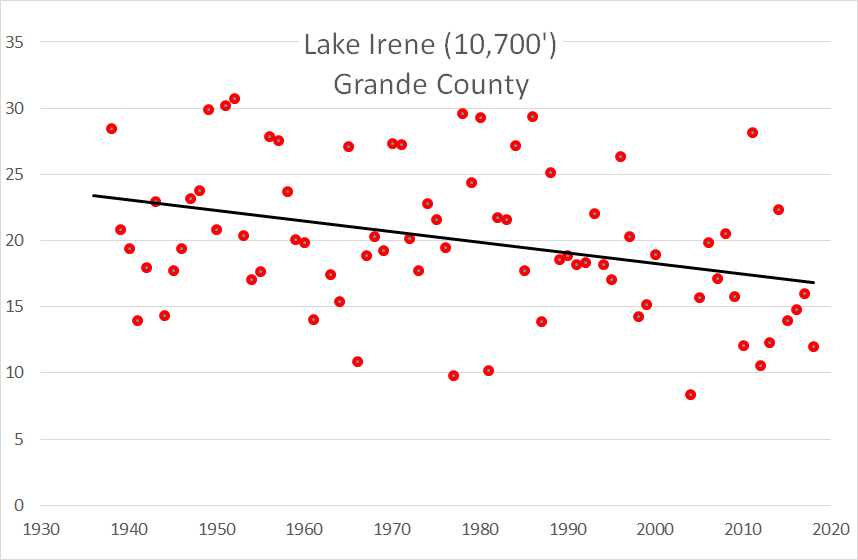
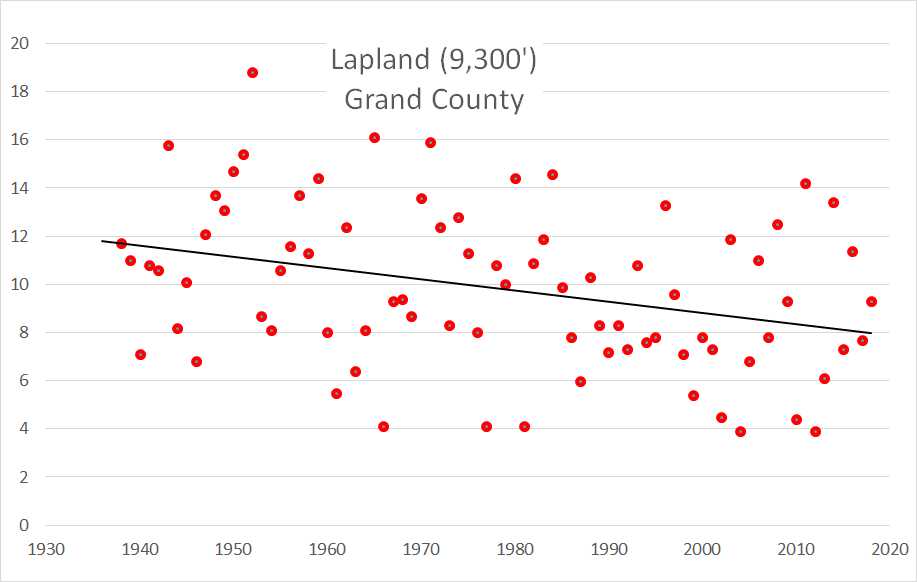
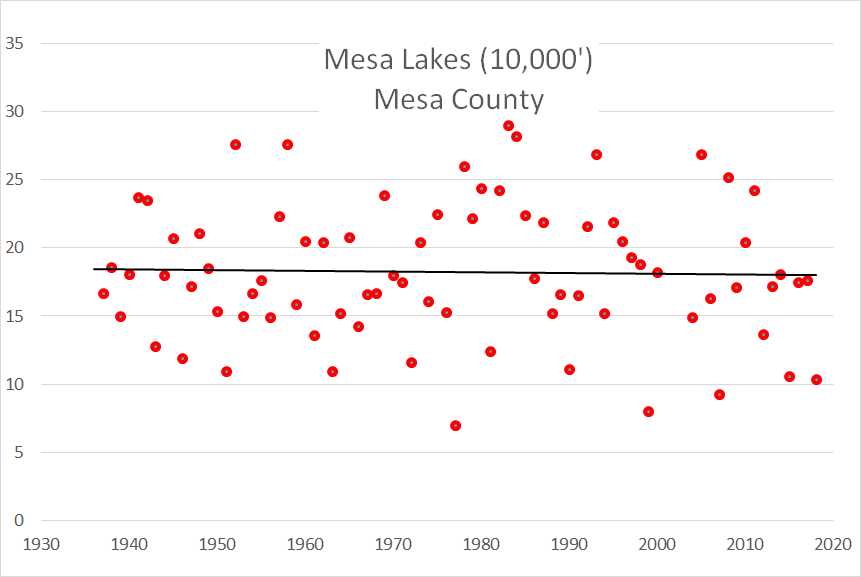
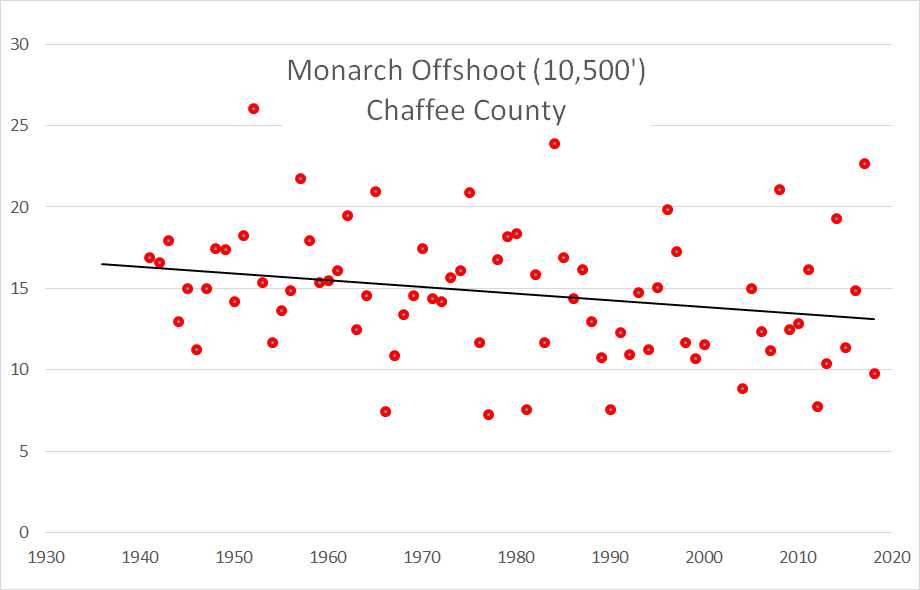
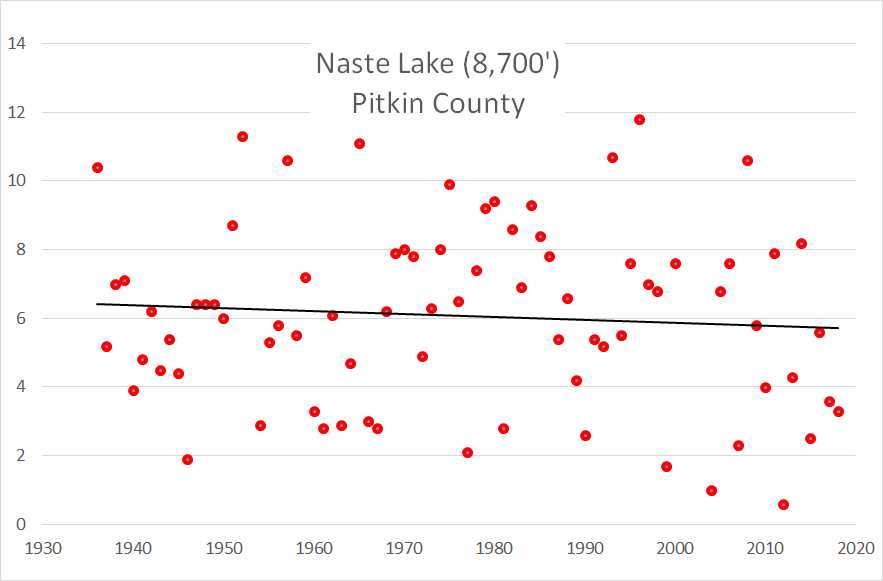
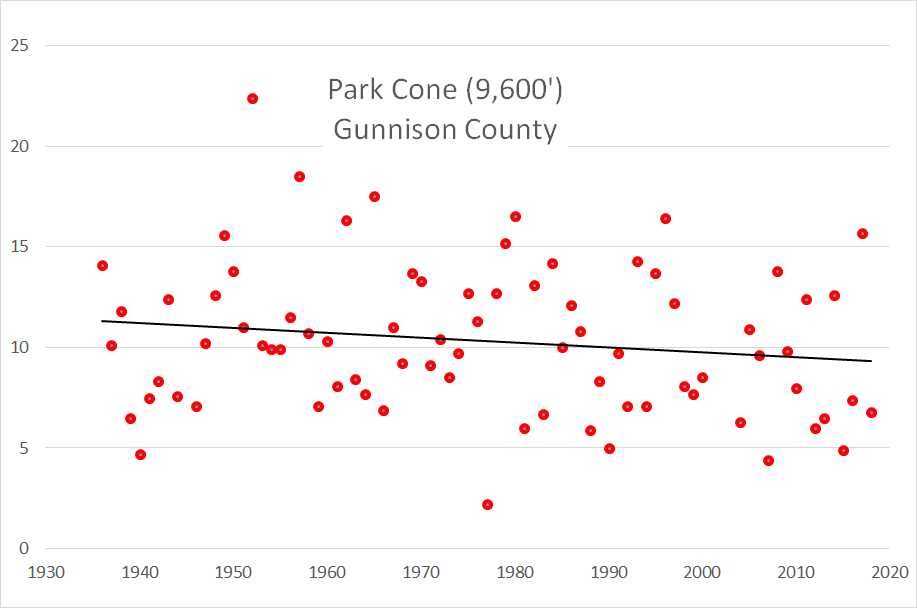
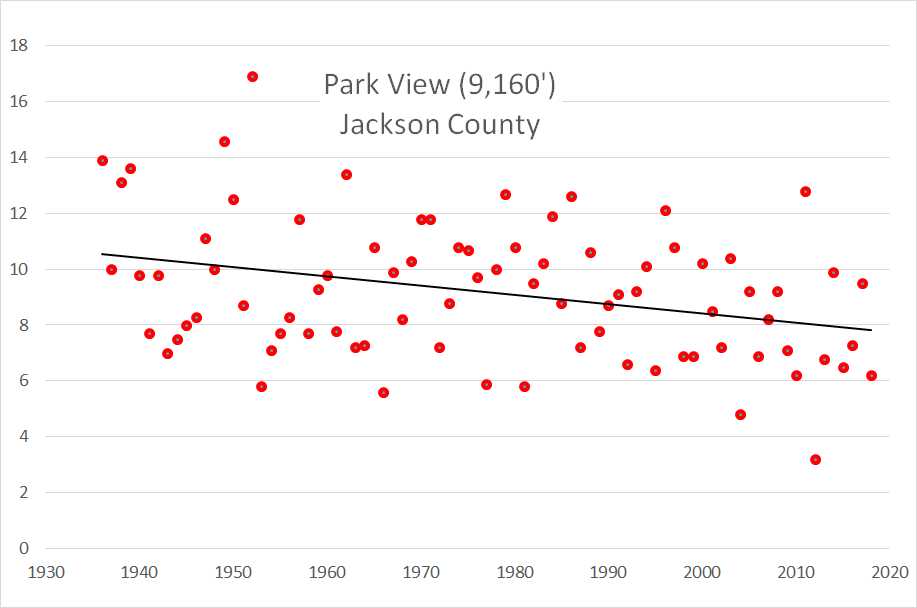
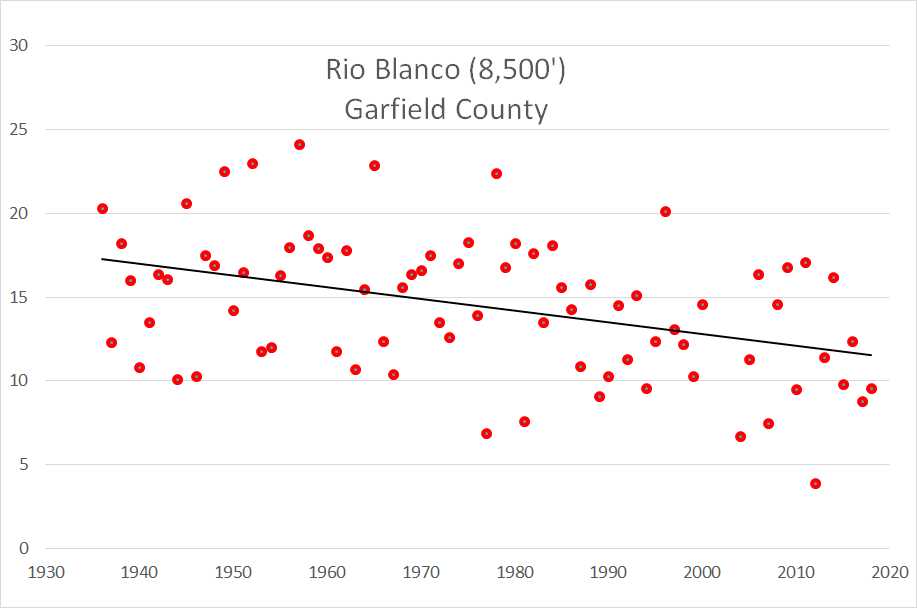
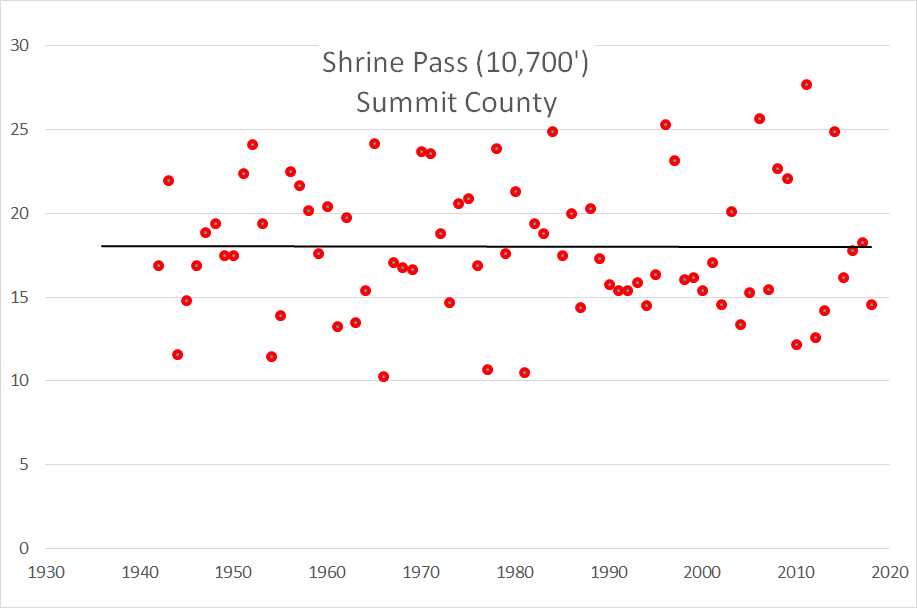
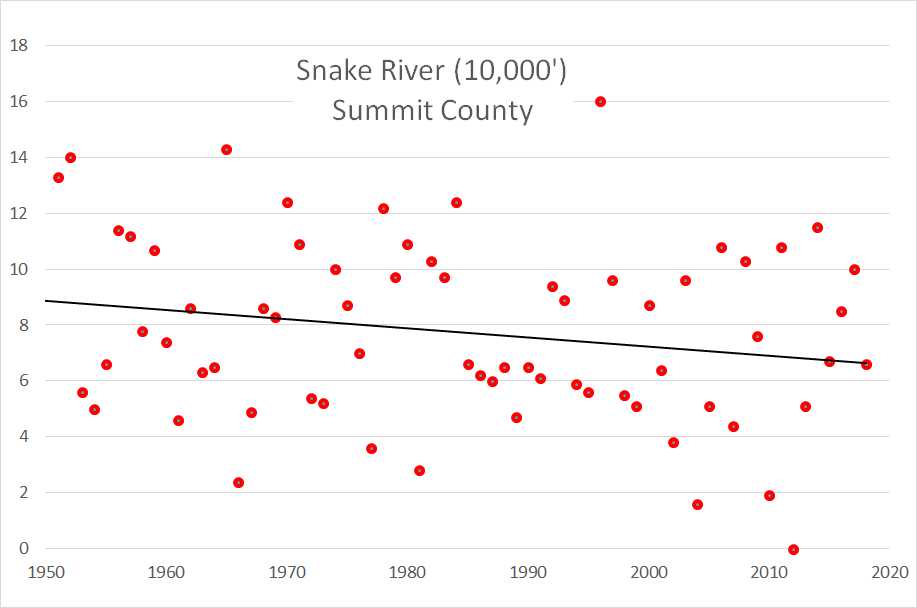
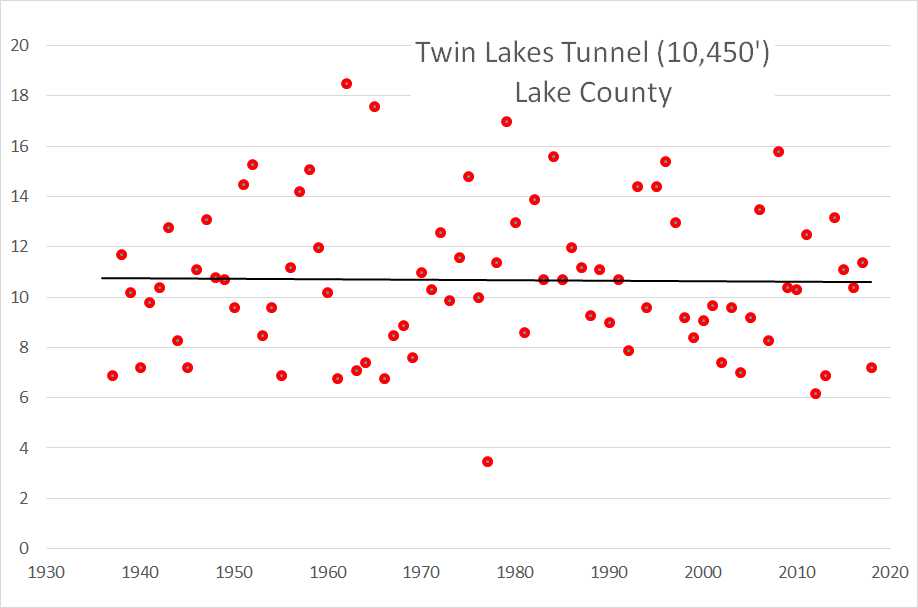
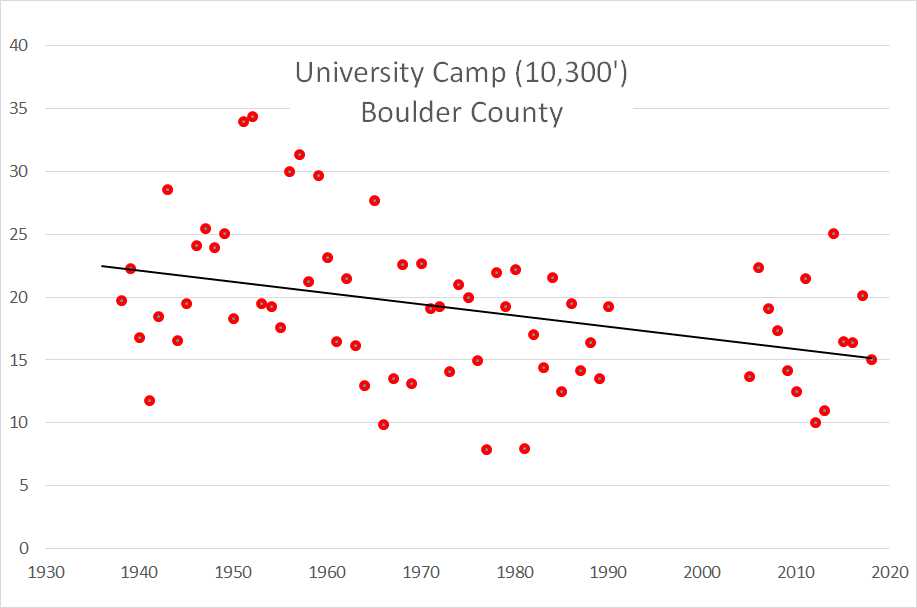
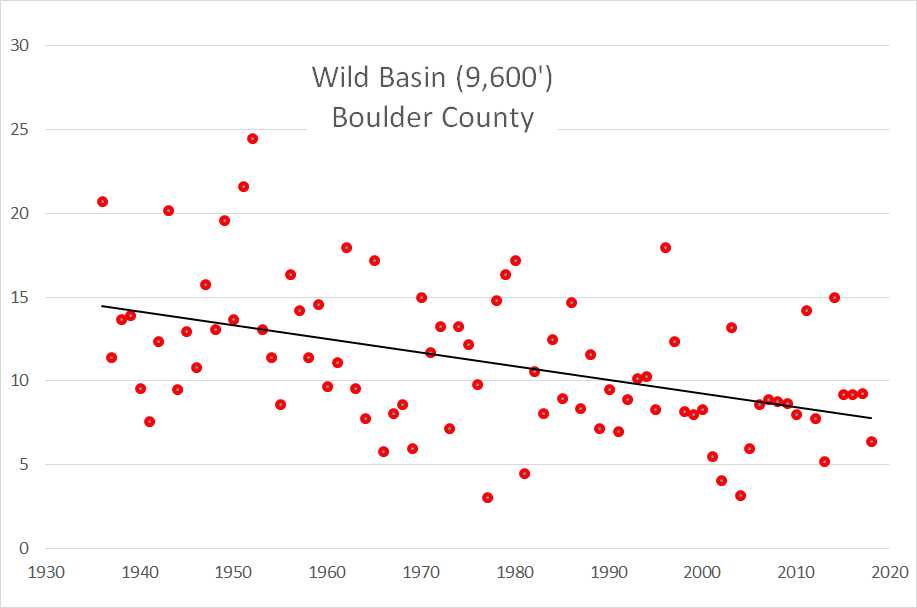
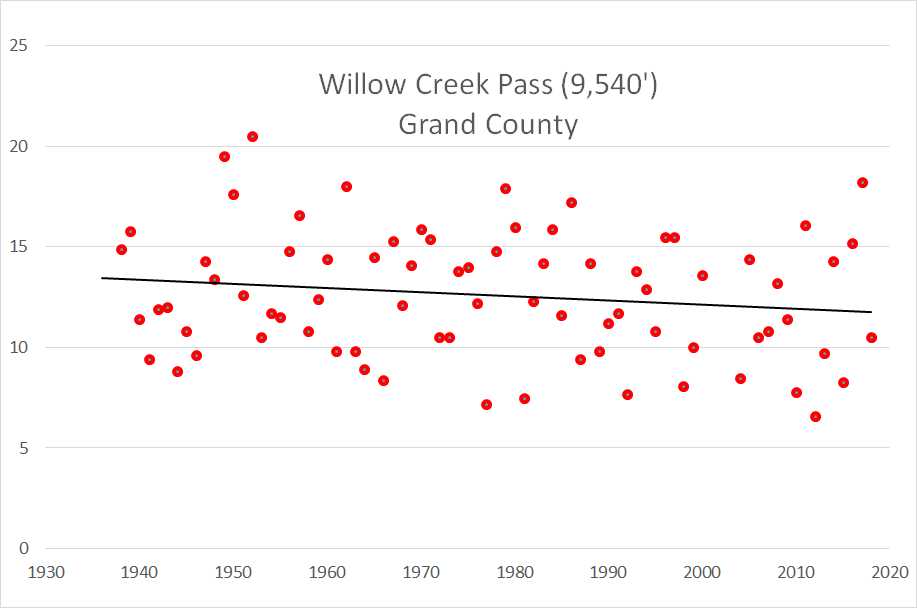
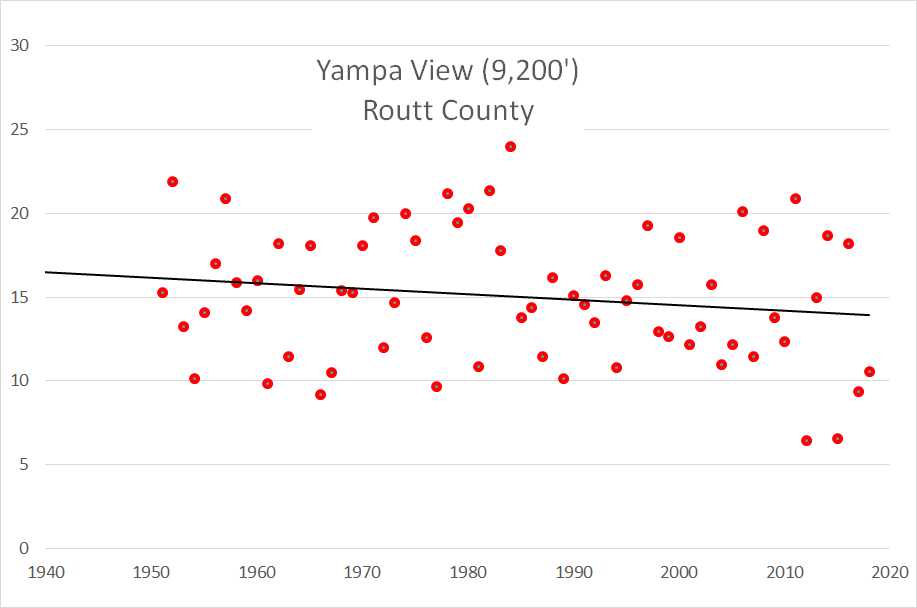
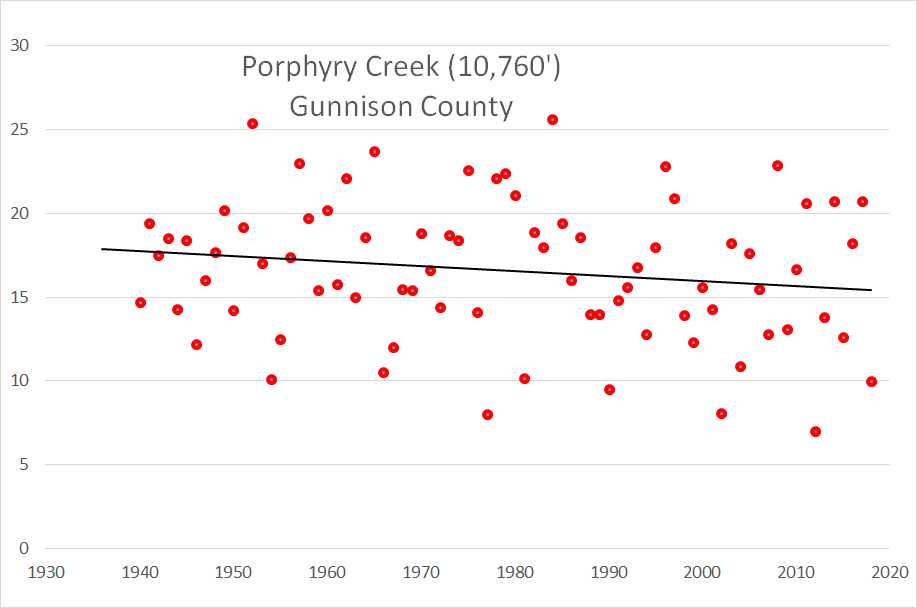
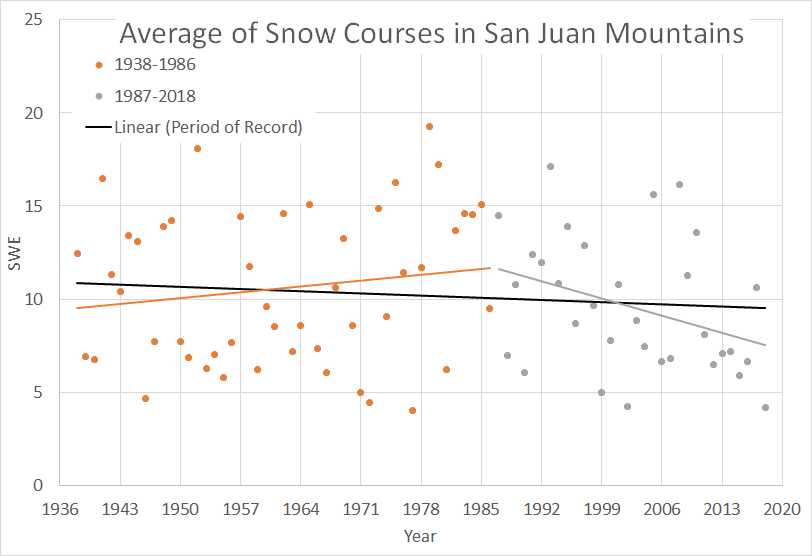
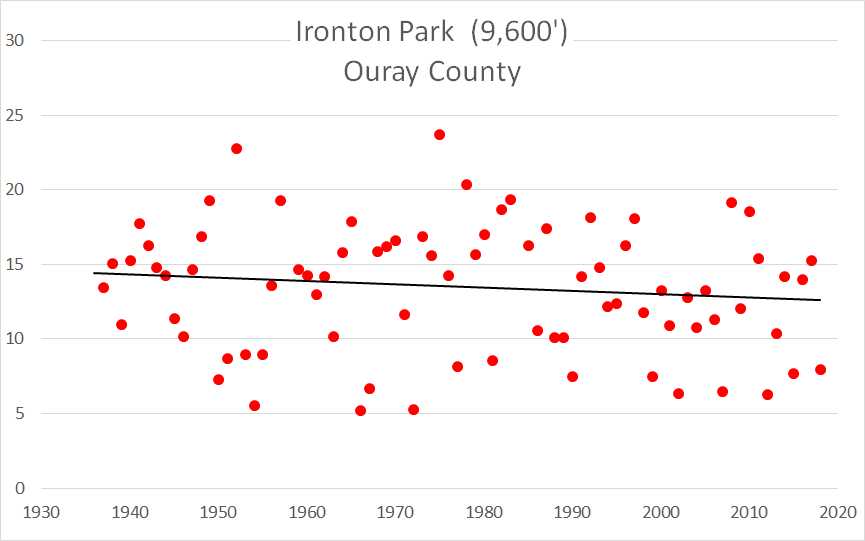
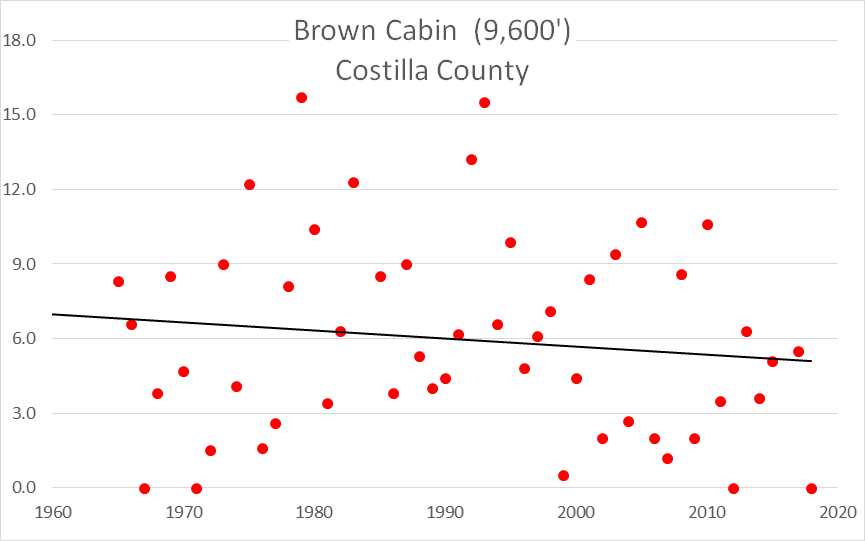
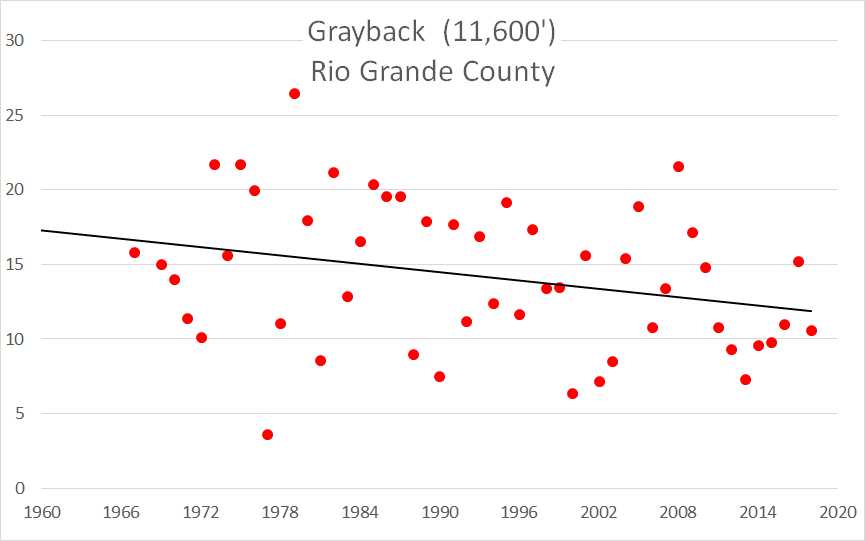
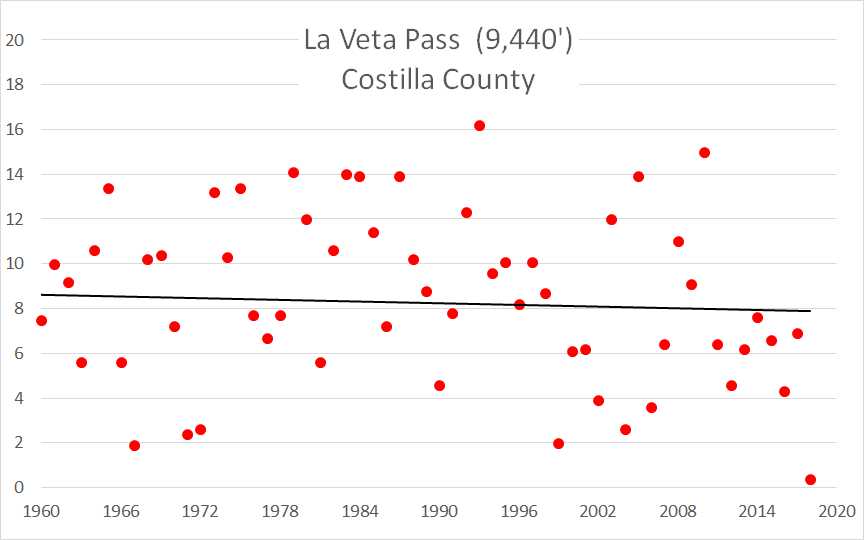
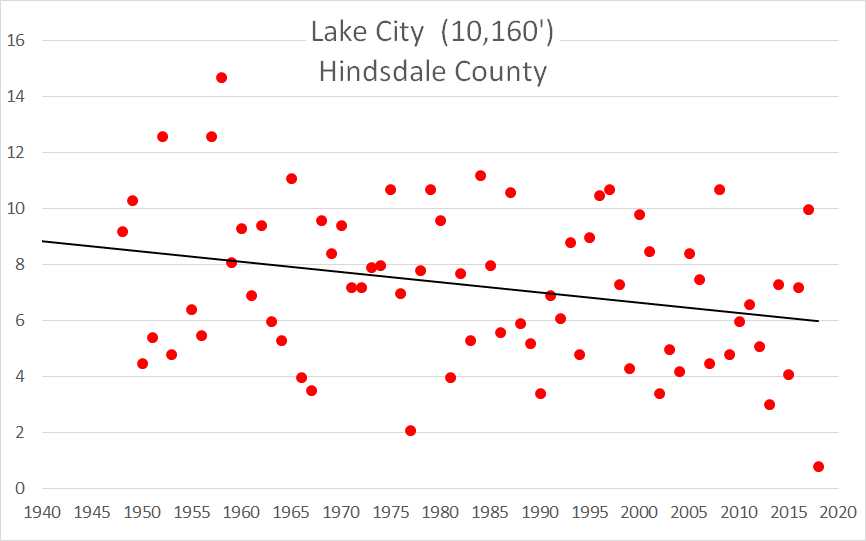
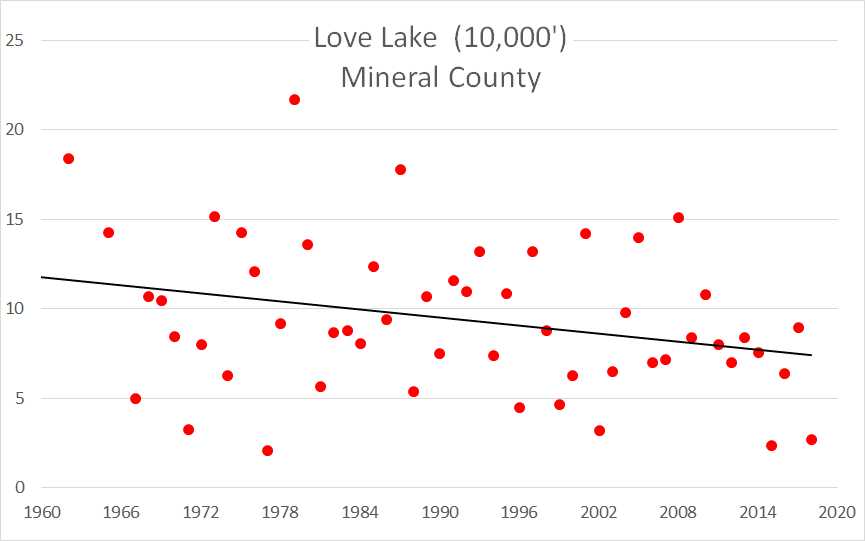
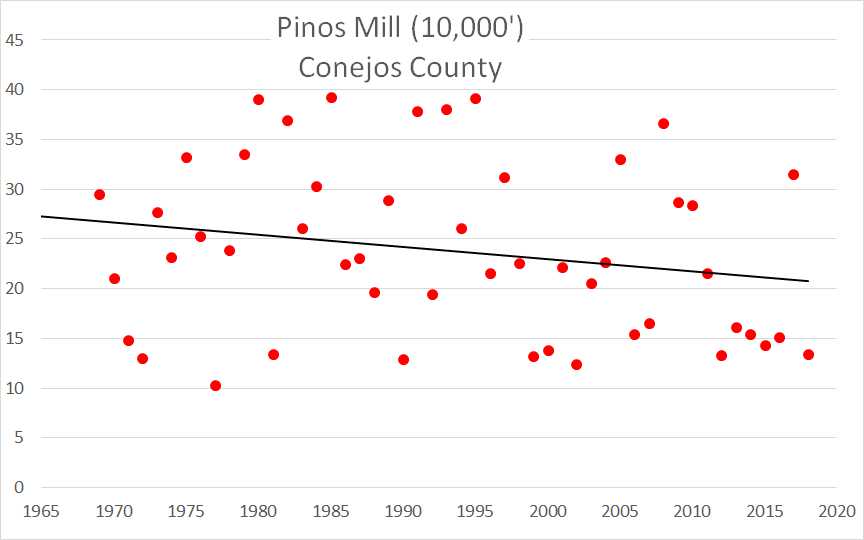
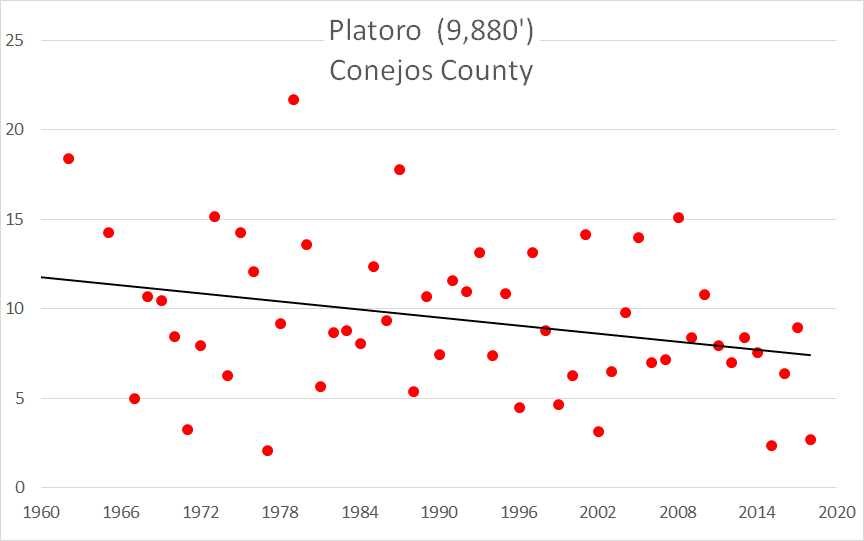
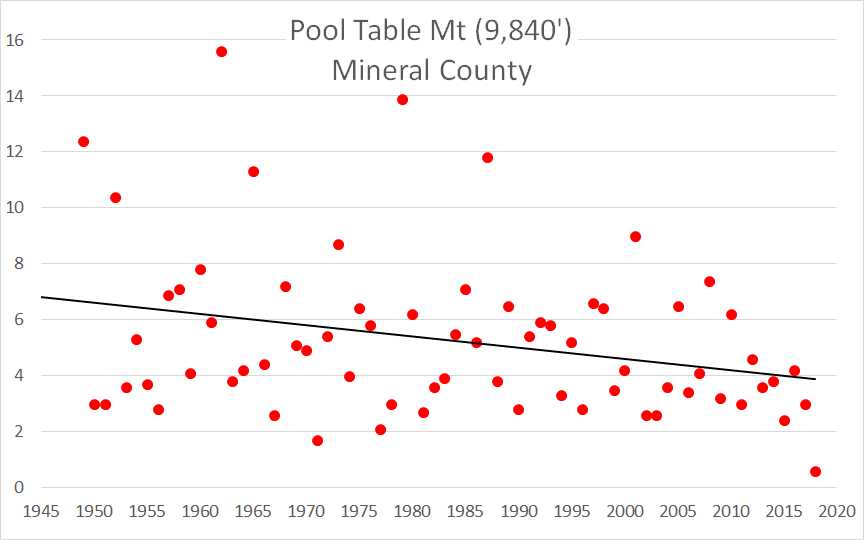
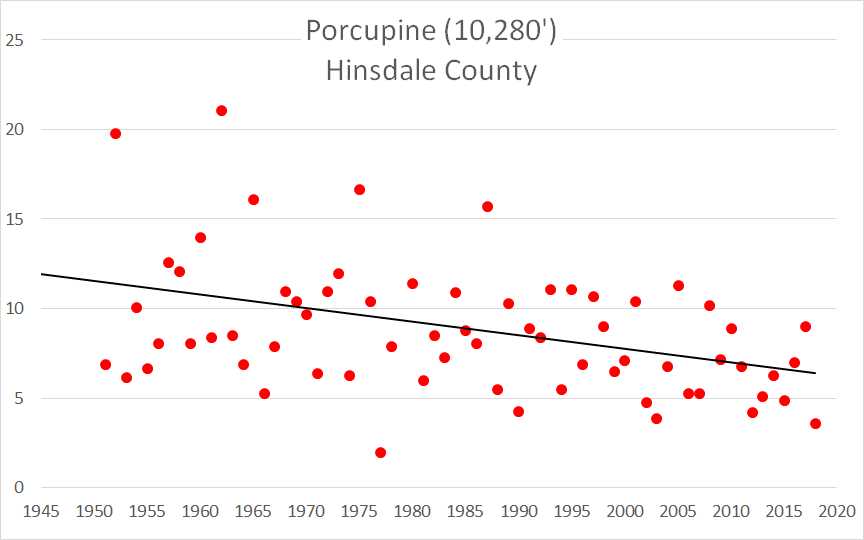
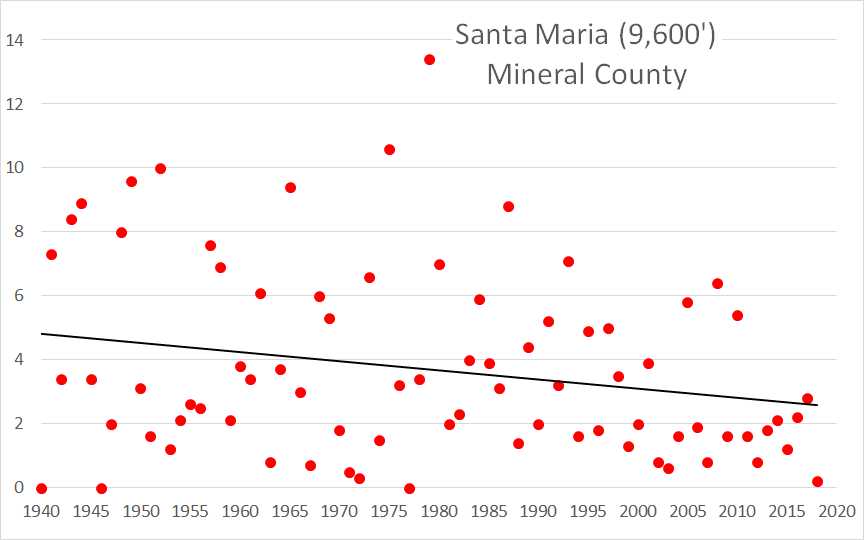
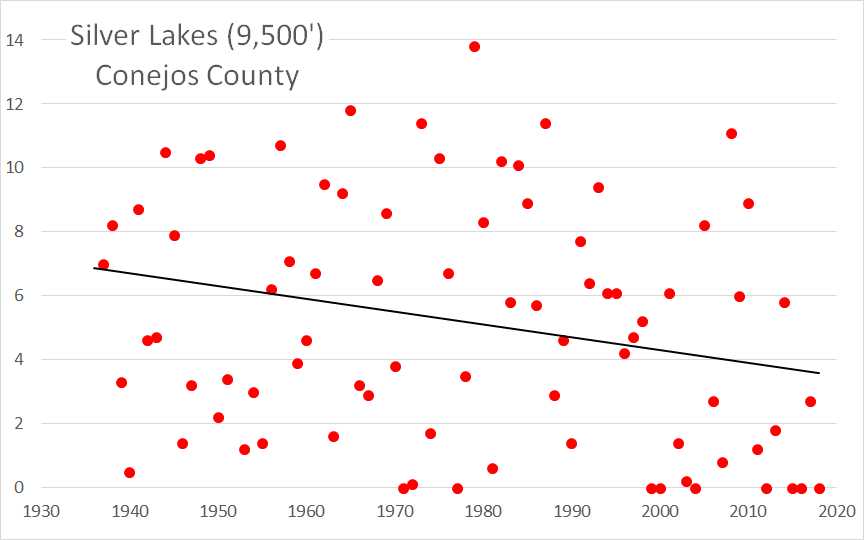
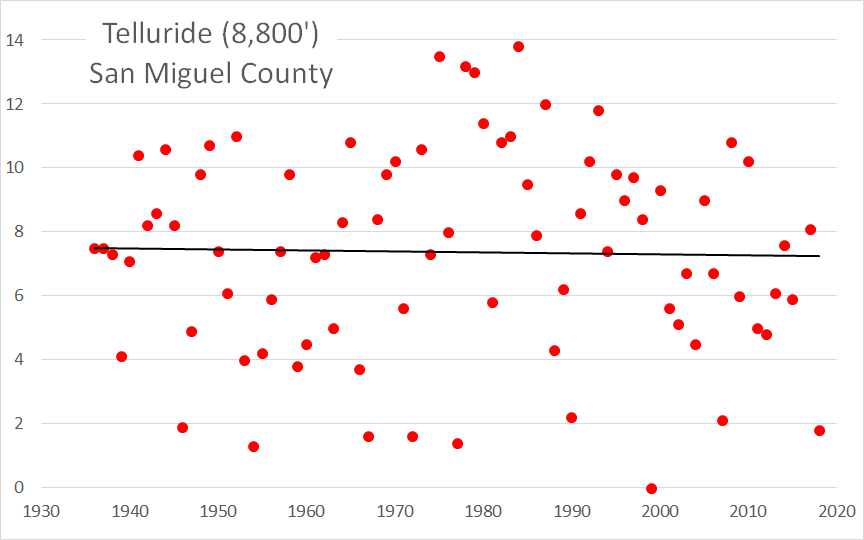
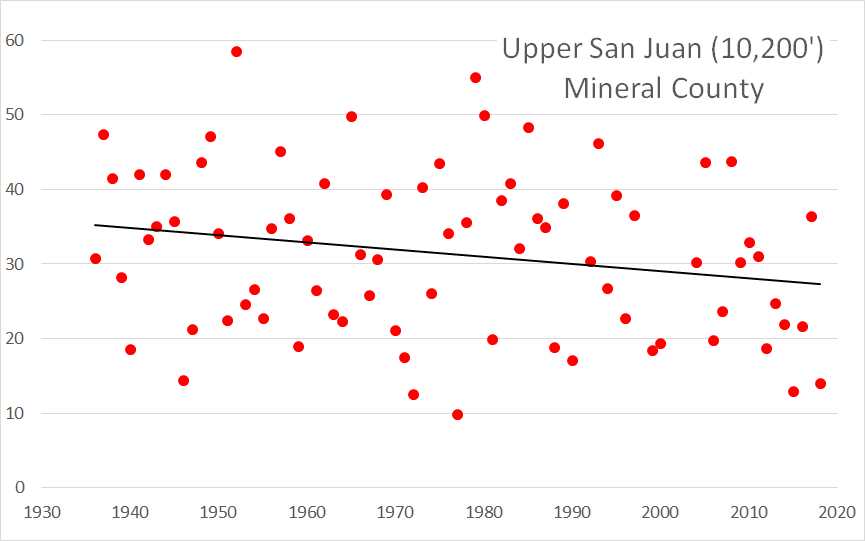
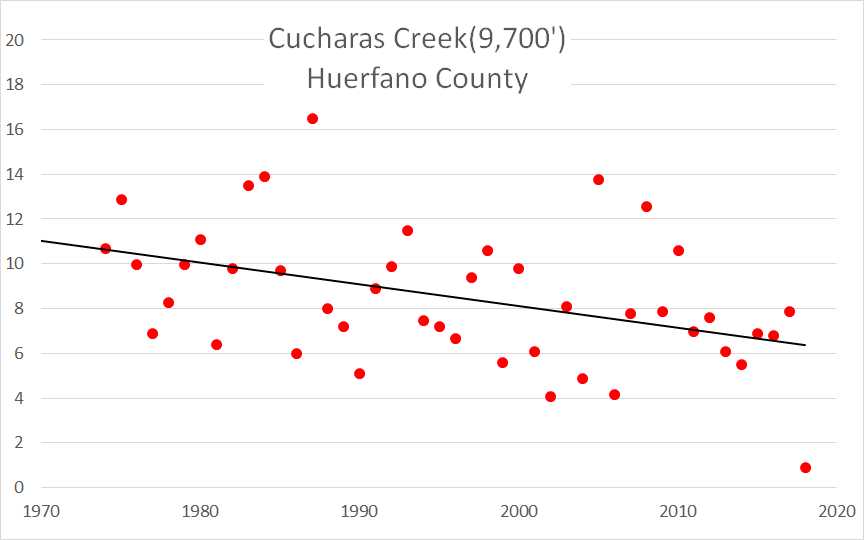
The plots above show snow course data for the state of Colorado. The snow course plots show data for stations in and near the San Juan Mountains. In Colorado, many snow courses were established in the 1930’s/40’s, a data record of ~80 years. Snow courses are manual measurements collected with a Federal Sampler which, by weighing the Sampler containing a core from the snowpack, directly translates to inches of water in that column of snow. Snow courses usually involve ~10-15 SWE measurements over a transect so the averaged SWE value that is reported contains at least some component of the spatial variability of the landscape. Snow course data are usually only collected at the first of the month during the spring (low temporal resolution). Automated SNOTEL stations on the other hand report on a daily basis, so you can look at the data on the computer every morning and see how bad/good the snowpack is doing. SNOTEL SWE data is point data, meaning the SWE value comes from a “pillow” that essentially weighs the overlaying mass of snow (no integration of spatial variability). SNOTEL stations collect other beneficial information like precipitation, air temperature, snow depth, wind speed/direction. Many SNOTEL stations were established near snow course sites to correlate data records. Now that many SNOTEL stations have been in place 30-40 years, the data seems to be used and referenced much more frequently than snow course data, but is important to consider the value of snow course data.
Below: Summary data for WY2018 at the 16 SNOTEL stations that CODOS monitors. The table shows peak SWE, and calculated from the day of peak SWE, melt rates, days to snow-all-gone, and mean temperature.
Below. A summary of WY 2006-2018 snowmelt rates and associated conditions at the 16 SNOTEL stations that CODOS routinely monitors, statewide. Days to SAG refers to the time between peak SWE and “snow all gone” at the SNOTEL sites. Adjusted Daily Mean Loss calculates the rate of snowmelt following peak SWE, including all precipitation received after peak SWE (assumed to be snow). Melt rate tables are presented for each of the 11 CODOS monitoring sites on their webpages.

Snow depth at Swamp Angel Study Plot.

Snow depth at Senator Beck Study Plot.

Snow water equivalent at Swamp Angel.

Snow water equivalent at Senator Beck Study Plot.
DUST-ON-SNOW CONDITIONS
DUST ENHANCED RUNOFF CLASSIFICATION:
In Water Year 2015 CODOS introduced a Dust Enhanced Runoff Classification (DERC) approach to linking dust-on-snow, snowpack, and spring weather conditions to patterns in statewide hydrographs within a 3x3x3 Dust Enhanced Runoff Space. The below table presents the final DERC classification of WY2018 parameters at each of the 20 stream gauges monitored by CODOS. Water Years 2006-2018 classifications are contained in Excel workbook Runoff_Space_by_Region_and_WY.xlsx. Another workbook, Runoff_Space_by_Watershed.xlsx, contains individual DERC analyses for WY 2006-2018 for each of the 20 stream gauges.
A conceptual Dust Enhanced Snowmelt Runoff Space integrating the interactions of March 1 SWE, dust intensity, and spring precipitation.
Below. Based on the discussions describing the DERC approach in characterizing the watersheds that CODOS monitors, WY2018 snowmelt season conditions are summarized in the tables below. Essentially, Colorado WY2018 snowmelt runoff behaviors fell into general patterns of “Average Dust”, mostly “Low" March 1 SWE, and mostly “Dry” spring.
Table below indicates placement of individual CODOS sites for WY2018 within the DERC framework and suggests years with comparable local hydrographs, where applicable.
The Senator Beck Basin received 8 dust events this season, with some of the events being very significant in their dust loading. Dust events D5 and D7 were particularly dark and concentrated layers. We are classifying this year as “Average” within the DERC framework for dust loading in the SBB as well as statewide this season. In Southwest Colorado our dust loading was towards the maximum of average, while in the Front Range we saw dust conditions toward the minimum end of average. The central and northern mountains fell squarely in the middle of the average category.
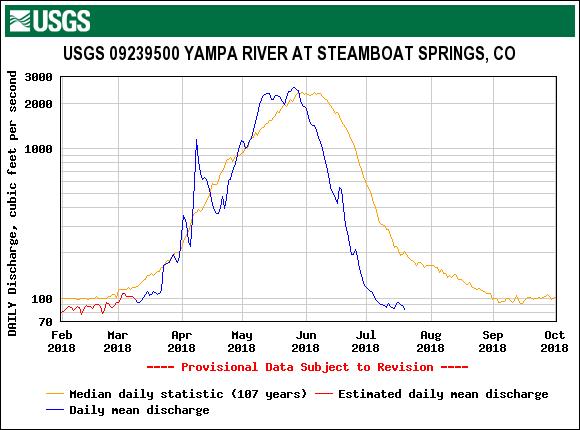
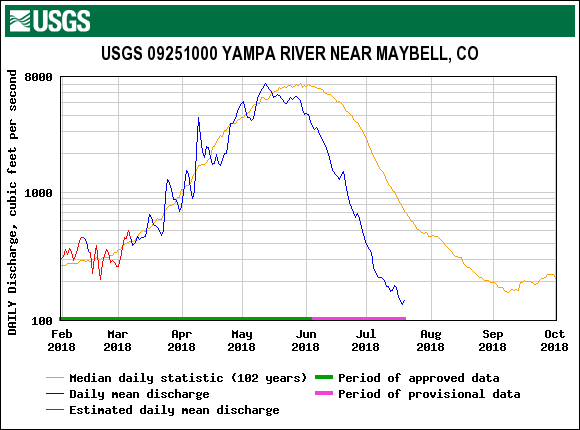
In Southwest Colorado there were very few storm events to keep the dust covered and long stretches of hot clear weather melted new snows quickly, exposing dust layers shortly after they were buried. This led to early spikes in runoff and very early snow all gone dates at Southern CODOS Sites. Northern and Eastern sites saw more significant spring snowfall which kept the less severe dust layers buried for longer. These regions saw spikes in runoff weeks later than Southwest Colorado. When many of these areas with later melt schedules still had notable snow cover at high elevations, the San Juans and Rio Grande were already feeling like summer.
Total dust-on-snow events by month. March begins the more intensive part of dust-on-snow season. In WY2018, 6 of the 8 dust events occurred after late March, placing those dust layers within the upper portion of the snowpack.
Total dust-on-snow events by year. Two dust events in 2017/2018 were “wet” events, accompanied with precipitation. Six events was “dry”, occurring without precipitation or just prior to precipitation.
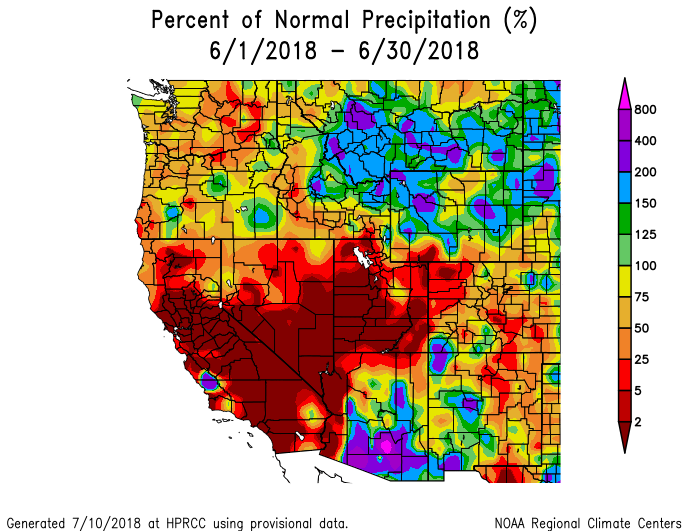
Variance of combined March, April, and May precipitation as of June 1, 2018, for the SNOTEL stations adjacent to or near CODOS monitoring sites.
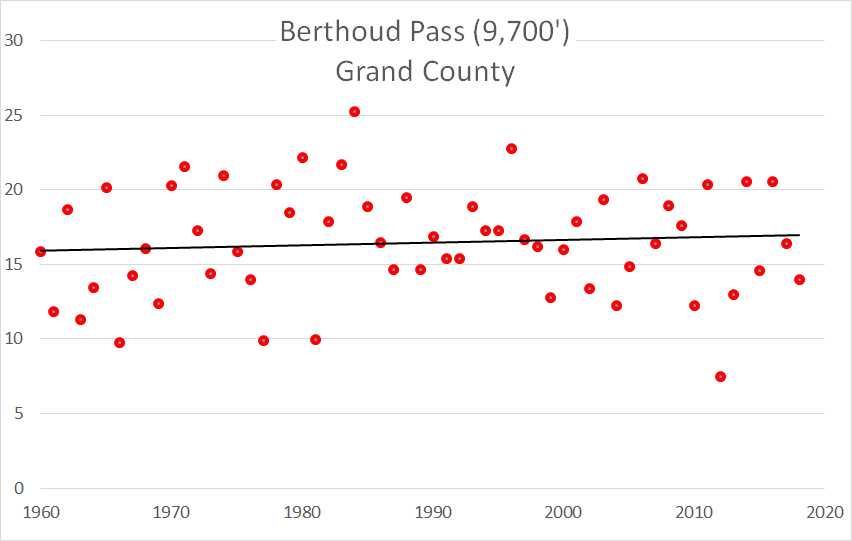
Most of the mountainous parts of the state experienced a dry spring, with about two thirds of sites receiving less than 70% of their median March-May precipitation. The only exceptions were Rabbit Ears Pass, which received 107% of median springtime precipitation, and Berthoud Pass which received 95% of median springtime precipitation. This sets these two sites in the Average category. Additionally, almost every site monitored by CODOS met our "Low" March 1 SWE requirement, where the normal range is within +/-10% of median March 1 SWE. Hoosier Pass and Loveland Pass fell into our "Average" category, with 100% and 94% of median March 1 SWE respectively. Willow Creek Pass barely broke into the “High” March 1 SWE category with 112% of average SWE at the SNOTEL for that date. To sum it up, the majority of Colorado’s mountains had a below average winter, with some places receiving some of the lowest recorded snowfall in decades. Only areas well east of the Continental Divide saw average or above average snow. Statewide, March 1 SWE was at 76% of average.
RUNOFF BEHAVIOR
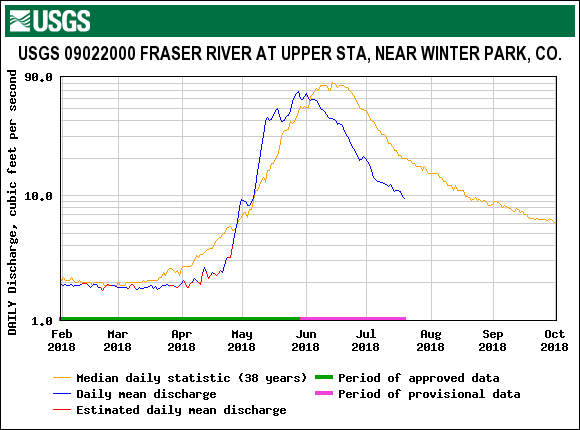
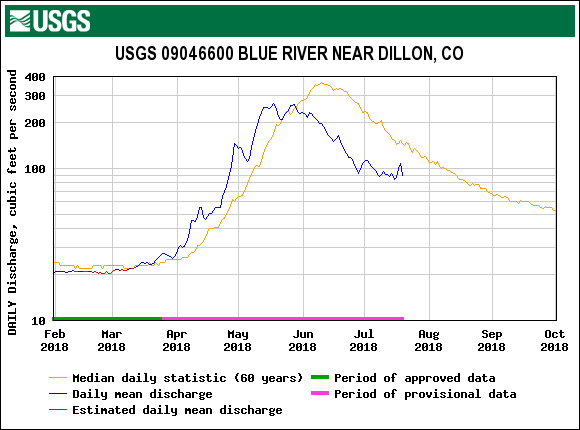
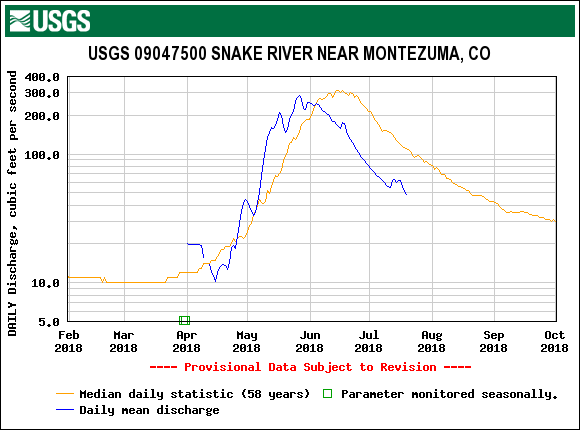
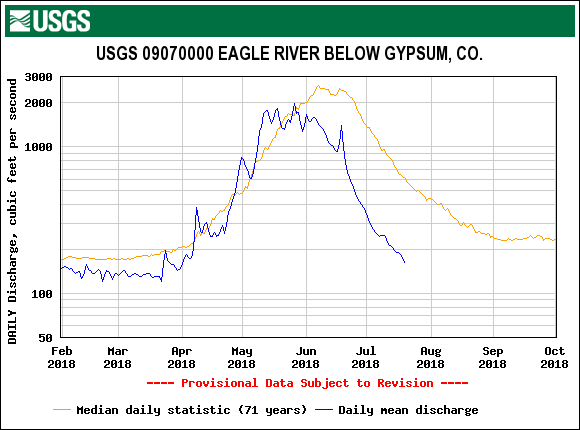
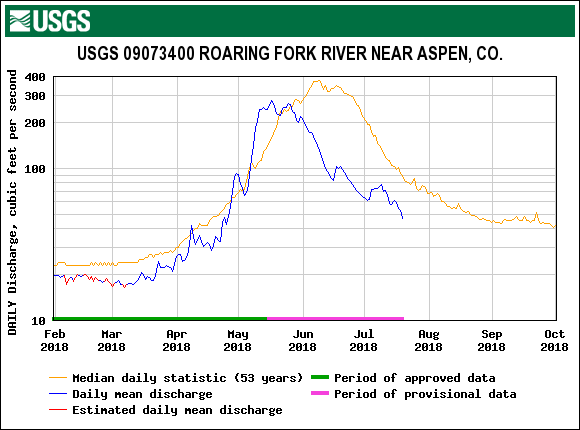
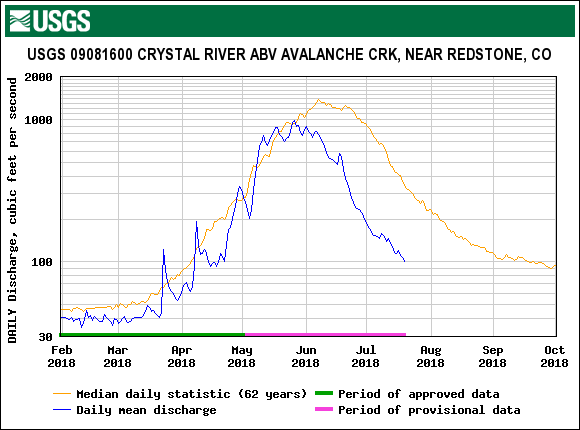
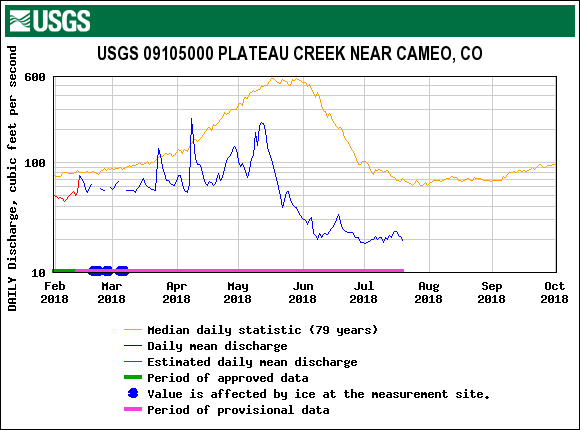
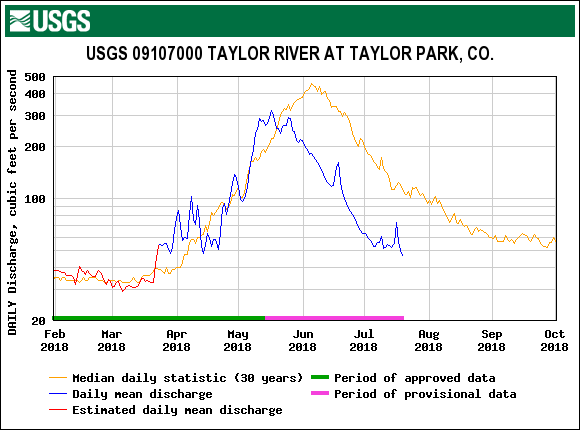
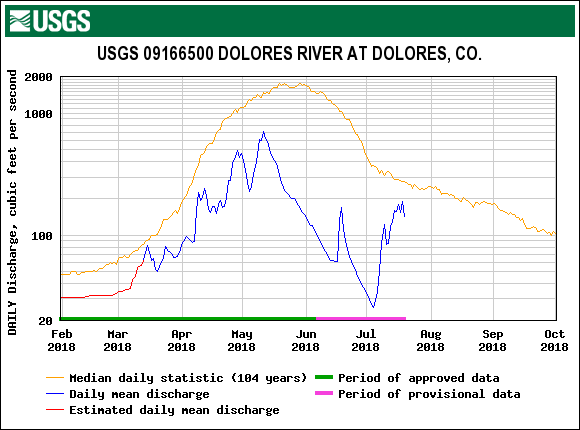
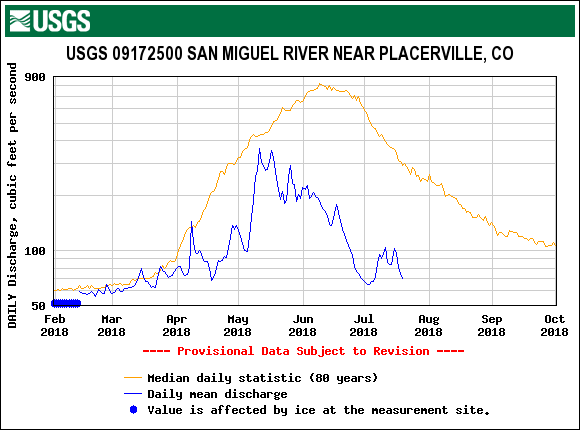
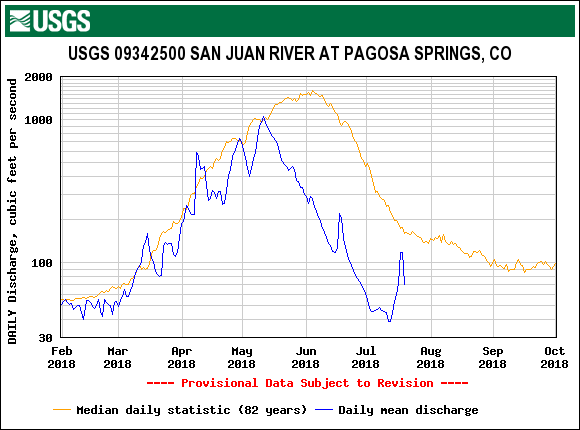
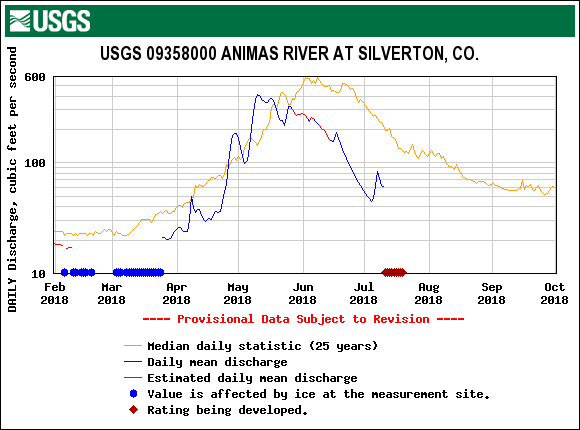
Most notable in the southern part of Colorado the combination of a shallow snowpack, much warmer than normal air temperatures, considerable dust-on-snow conditions along with an almost complete lack of late spring precipitation, resulted in streams seeing a shorter time from the beginning of snowmelt to peak discharge, early peak discharge, rapid recession of the falling limb of the hydrograph, very low cumulative discharge, and many occasions record low streamflow.
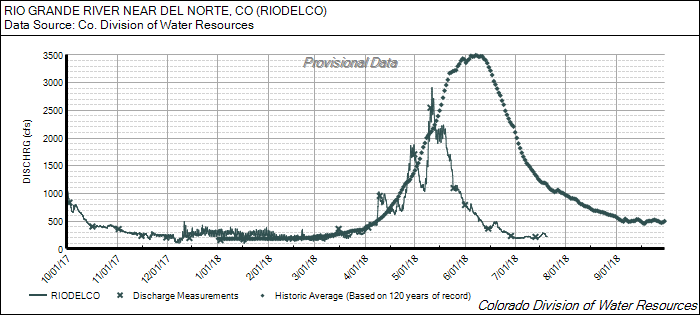
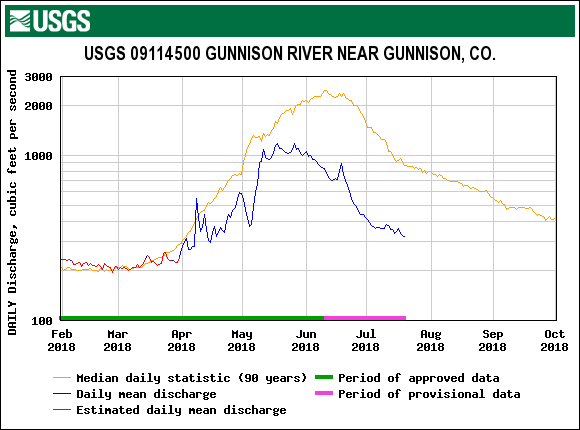
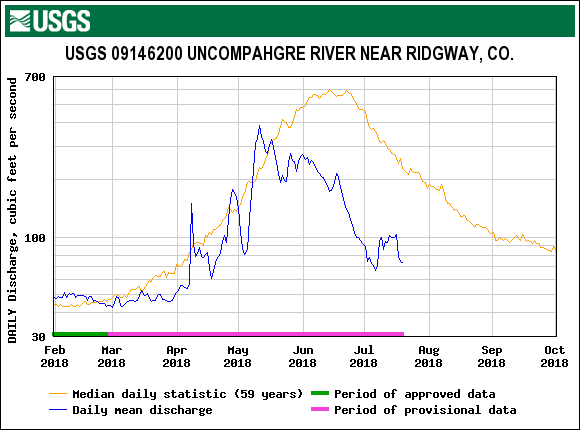
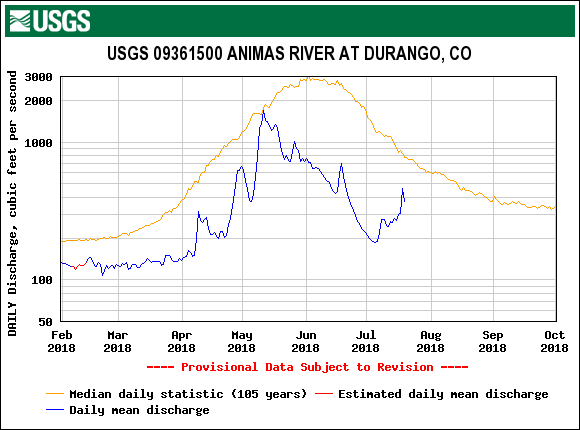
At SBB peak discharge occurred on May 17, 17 days earlier that the median peak date of June 2. Interestingly, SBB usually reaches peak discharge within +/- a day of surrounding stream gauges, but this year the Uncompahgre at Ridgway, Animas at Durango, Rio Grande at Del Norte, and San Juan at Pagosa, reached peak discharge on May 11. This is testament to the lack of contributing snowmelt, and rapid early melt, from lower elevations in these watersheds. The date of peak discharge was 36 days early for the Uncompahgre, 24 days early for the Animas, 29 days early for the Rio Grande, and 26 days early for the San Juan.
We saw the usual second peak at SBB on May 25 which was very near the same discharge as the first peak on May 17. This second peak represents the contribution from higher elevations, around 12,000' and higher. Typically, the first peak at SBB occurs when snow has reached all-gone status at SASP (11,060') and the second peak when SBSP (12,200') has reached snow-gone. That was the case this year with snow-gone at SASP on May 17 and gone at SBSP on May 23. This second peak was barely registered on gauges further downstream.
The combination of variables mentioned above made for a straight forward and relatively predictable snowmelt season. Once the merged dust layers were fully exposed, or even a few inches beneath surface, combined with a lack of winter storms in the forecast, then snowmelt would be intense. Looking at the Animas River hydrograph below as an example (the comments apply the same for other Southern Colorado watersheds), demonstrate how this unfolded. The comments are taken from our CODOS updates and the arrows point to the date the CODOS update was issued to assess the timeliness and relevance of our updates during spring. An atmospheric river occurred on April 6-8 that buried D3/D4 and, being a warm and wet event, contributed to struggling streamflows. The rest of April shows the interplay of 2 more winter storms, the last ending on April 21, and emerging dust layers. The final winter storm May 1-2 provided the last opportunity to contribute to the snowpack and provide a very temporary albedo reset. After this storm snow continued its rapid melt unabated. The next real precipitation event was mid-June in the form of rain and the signature is seen in the hydrograph.
This meant that many reservoirs experienced some of their worst inflows on record, the worst for McPhee. April-July unregulated inflow forecasts for Fontenelle Reservoir is 135% of average, Flaming Gorge 114% of average, Blue Mesa Reservoir 40% of average, McPhee Reservoir 16% of average, and Navajo Reservoir 24% of average. The Lake Powell inflow forecast is 39% of average. This would be the 5th lowest April-July inflow on record for Lake Powell dating back to 1964.


This year at SBB we observed a peak discharge of 10.62 cfs on March 17, coinciding with snow-gone at Swamp Angel. The second peak of 10.44 on May 25 coincided with snow-gone at Senator Beck Study Plot.
Cumulative streamflow for WY2018 is the lowest in our period of record.

SBB stream discharge as it relates to albedo (or reflectance) of the snowpack. Only 1 significant albedo “reset” occurred May 1-2 with snow temporarily covering dust layers, decreasing absorption of solar radiation and slowing snowmelt. With all dust layers at the surface of the snowpack, along with a stretch of very dry/sunny days, snowmelt kicked into full gear and streamflows rapidly spiked much earlier than normal.

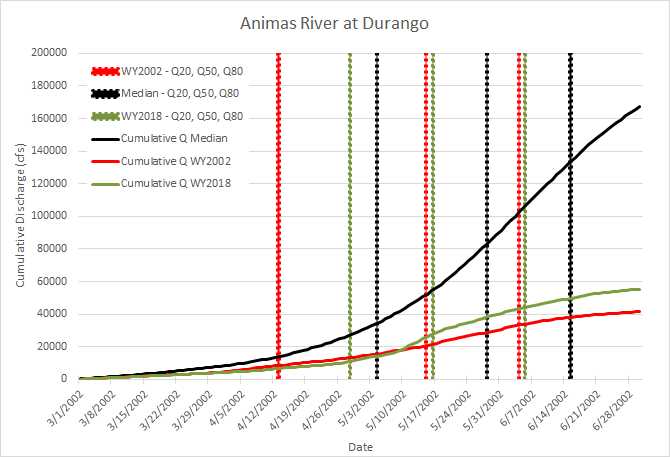
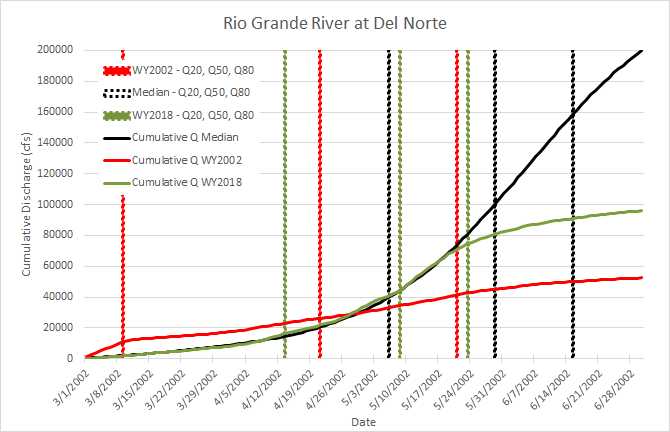
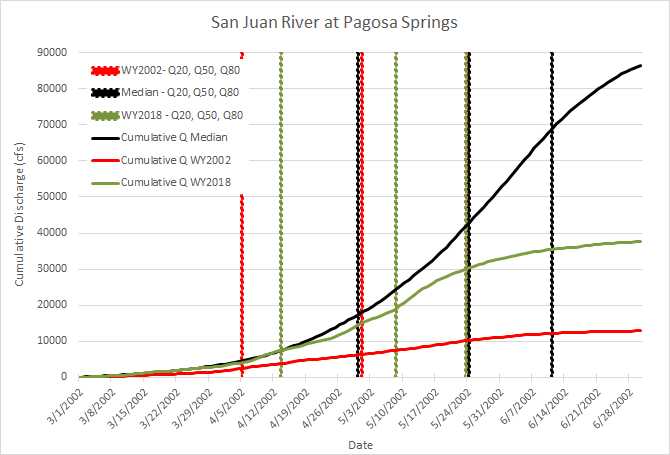
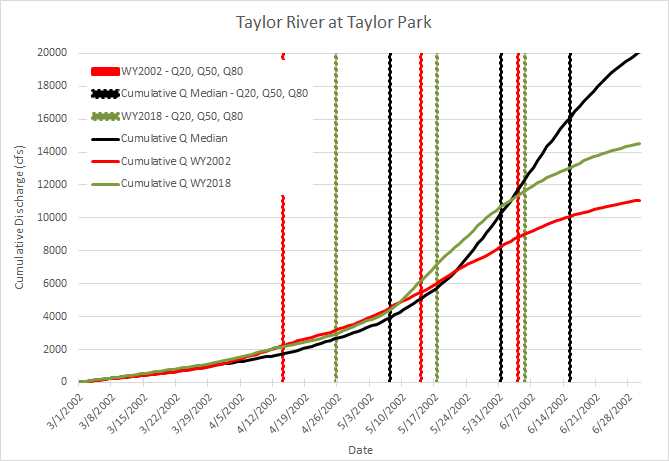
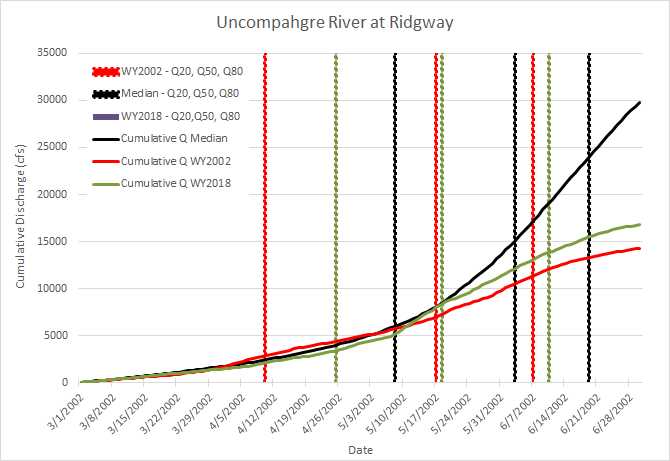
In March we published an Update showing cumulative streamflows, to date, for select streams. The graphs also included WY2002 since at that time it was an extreme, but comparable water year that could shed light on what we might see unfold come spring. Below are the completed WY2018 graphs for the entire snowmelt season. Streamflow timing indices were calculated based on cumulative flow from March 1 thru June 30, this time period captures the dominant snowmelt portion of the hydrograph for most rivers in Colorado. WY2002 and WY2018 were compared to median flows for the San Juan, Animas, Rio Grande, Taylor, and Uncompahgre rivers. Indices calculated are Q20, Q50, and Q80, corresponding to 20%, 50%, and 80% of cumulative flow having passed the stream gauge. These values approximate the beginning, middle, and end of the snowmelt period.
Cumulative discharge was 43% of median for the San Juan, 33% for the Animas, 48% for the Rio Grande, 72% for the Taylor, and 56% for the Uncompahgre river. All of these basins fared better than in WY2002. These plots help visualize how early snowmelt occurred this year, total cumulative discharge, and how quickly the bulk of snowmelt was over.
LOOKING AHEAD
Currently, all stream gauges in Colorado are well below normal. The mountains are experiencing hot summertime conditions. Streamflow will continue to slowly taper off to base flow levels or lower, with additional spikes during and after big rain events, especially during monsoon season which usually impacts the Southwestern US starting in July and going thru September. Fortunately forecasts are calling for a strong monsoon season, and we have seen the beginnings of the monsoon so far this month July 1-24 with 2" (53 mm) precipitation recorded at Swamp Angel.
El Niño Southern Oscilation (ENSO) is a periodic fluctuation in sea surface temperature and the air pressure of the overlying atmosphere across the equatorial Pacific Ocean. ENSO predictions and what it might mean for the 2018/19 snowpack are taking shape. The current outlook calls for neutral conditions through the summer. There is a 65% chance of El Niño conditions developing in Fall, increasing to 70% by winter. This could mean a welcome pattern shift from what we experienced last year, and while it appears that any El Niño will be weak/moderate, we will be closely following these conditions as El Niño often means more precipitation for Colorado.
Current long-term outlooks are suggesting the remaining summer and fall will be warmer than average with an increased chance of precipitation.


