SUMMARY
It was a sluggish start with precipitation for the WY 2024 snow season. At the beginning of January, most Colorado River basins were sitting at 50-70% median SWE. At Swamp Angel, we were behind on our storms - five storms as of the beginning January, down from the average eight, and they didn’t deliver anything spectacular. But just when we were twiddling our thumbs, the storms started to roll in. The most notable beginning-of-the-season storm was on January 11th which bumped up major Colorado basins to 70-99% of normal. Through February, the regional snowpack continued to make gains and more basins approached near-normal. On Feb 26-27 (D1), we received the first layer of dust on our snowpack of the season, which kicked up due to a couple of very windy days in the Four Corners region where we had reports of widespread dust mobilization. We saw a sort of pattern of repeatedly falling behind on SWE, and then surging to catch up with wet, atmospheric-river-like storms. The winds never fully abated at the end of February, and another bigger dust event occurred March 2-3 (D2); though those same winds brought an insulating layer of precipitation, which helped maintain a near-normal snowpack right at the kickoff of the annual CODOS Tour. Dust event #3 occurred March 30-31 (D3), and sustained high winds on April 4-5 (D4) ushered in the next dust event. In April, warm temperatures and dirty snow surfaces made a big-time dent in a near-normal Colorado snowpack. We saw some of the largest 14-day SWE loss in SNOTEL station records in southwest river basins – 8” loss from April 12-26 (check out Colorado Climate Center’s blog for more details) – not excluding Swamp Angel Study Plot. A cool May and precip (and dust May 7th (D5)) helped extend the melt season, and we even had some big snowfalls in the central mountains, which bumped regional SWE up to 136%. Swamp Angel snowpack fully melted out June 2nd and Colorado snowpack fully melted out by June 23rd. We ended the WY2024 season with an average dust year on an average snowpack.
MONTHLY WEATHER CONDITIONS
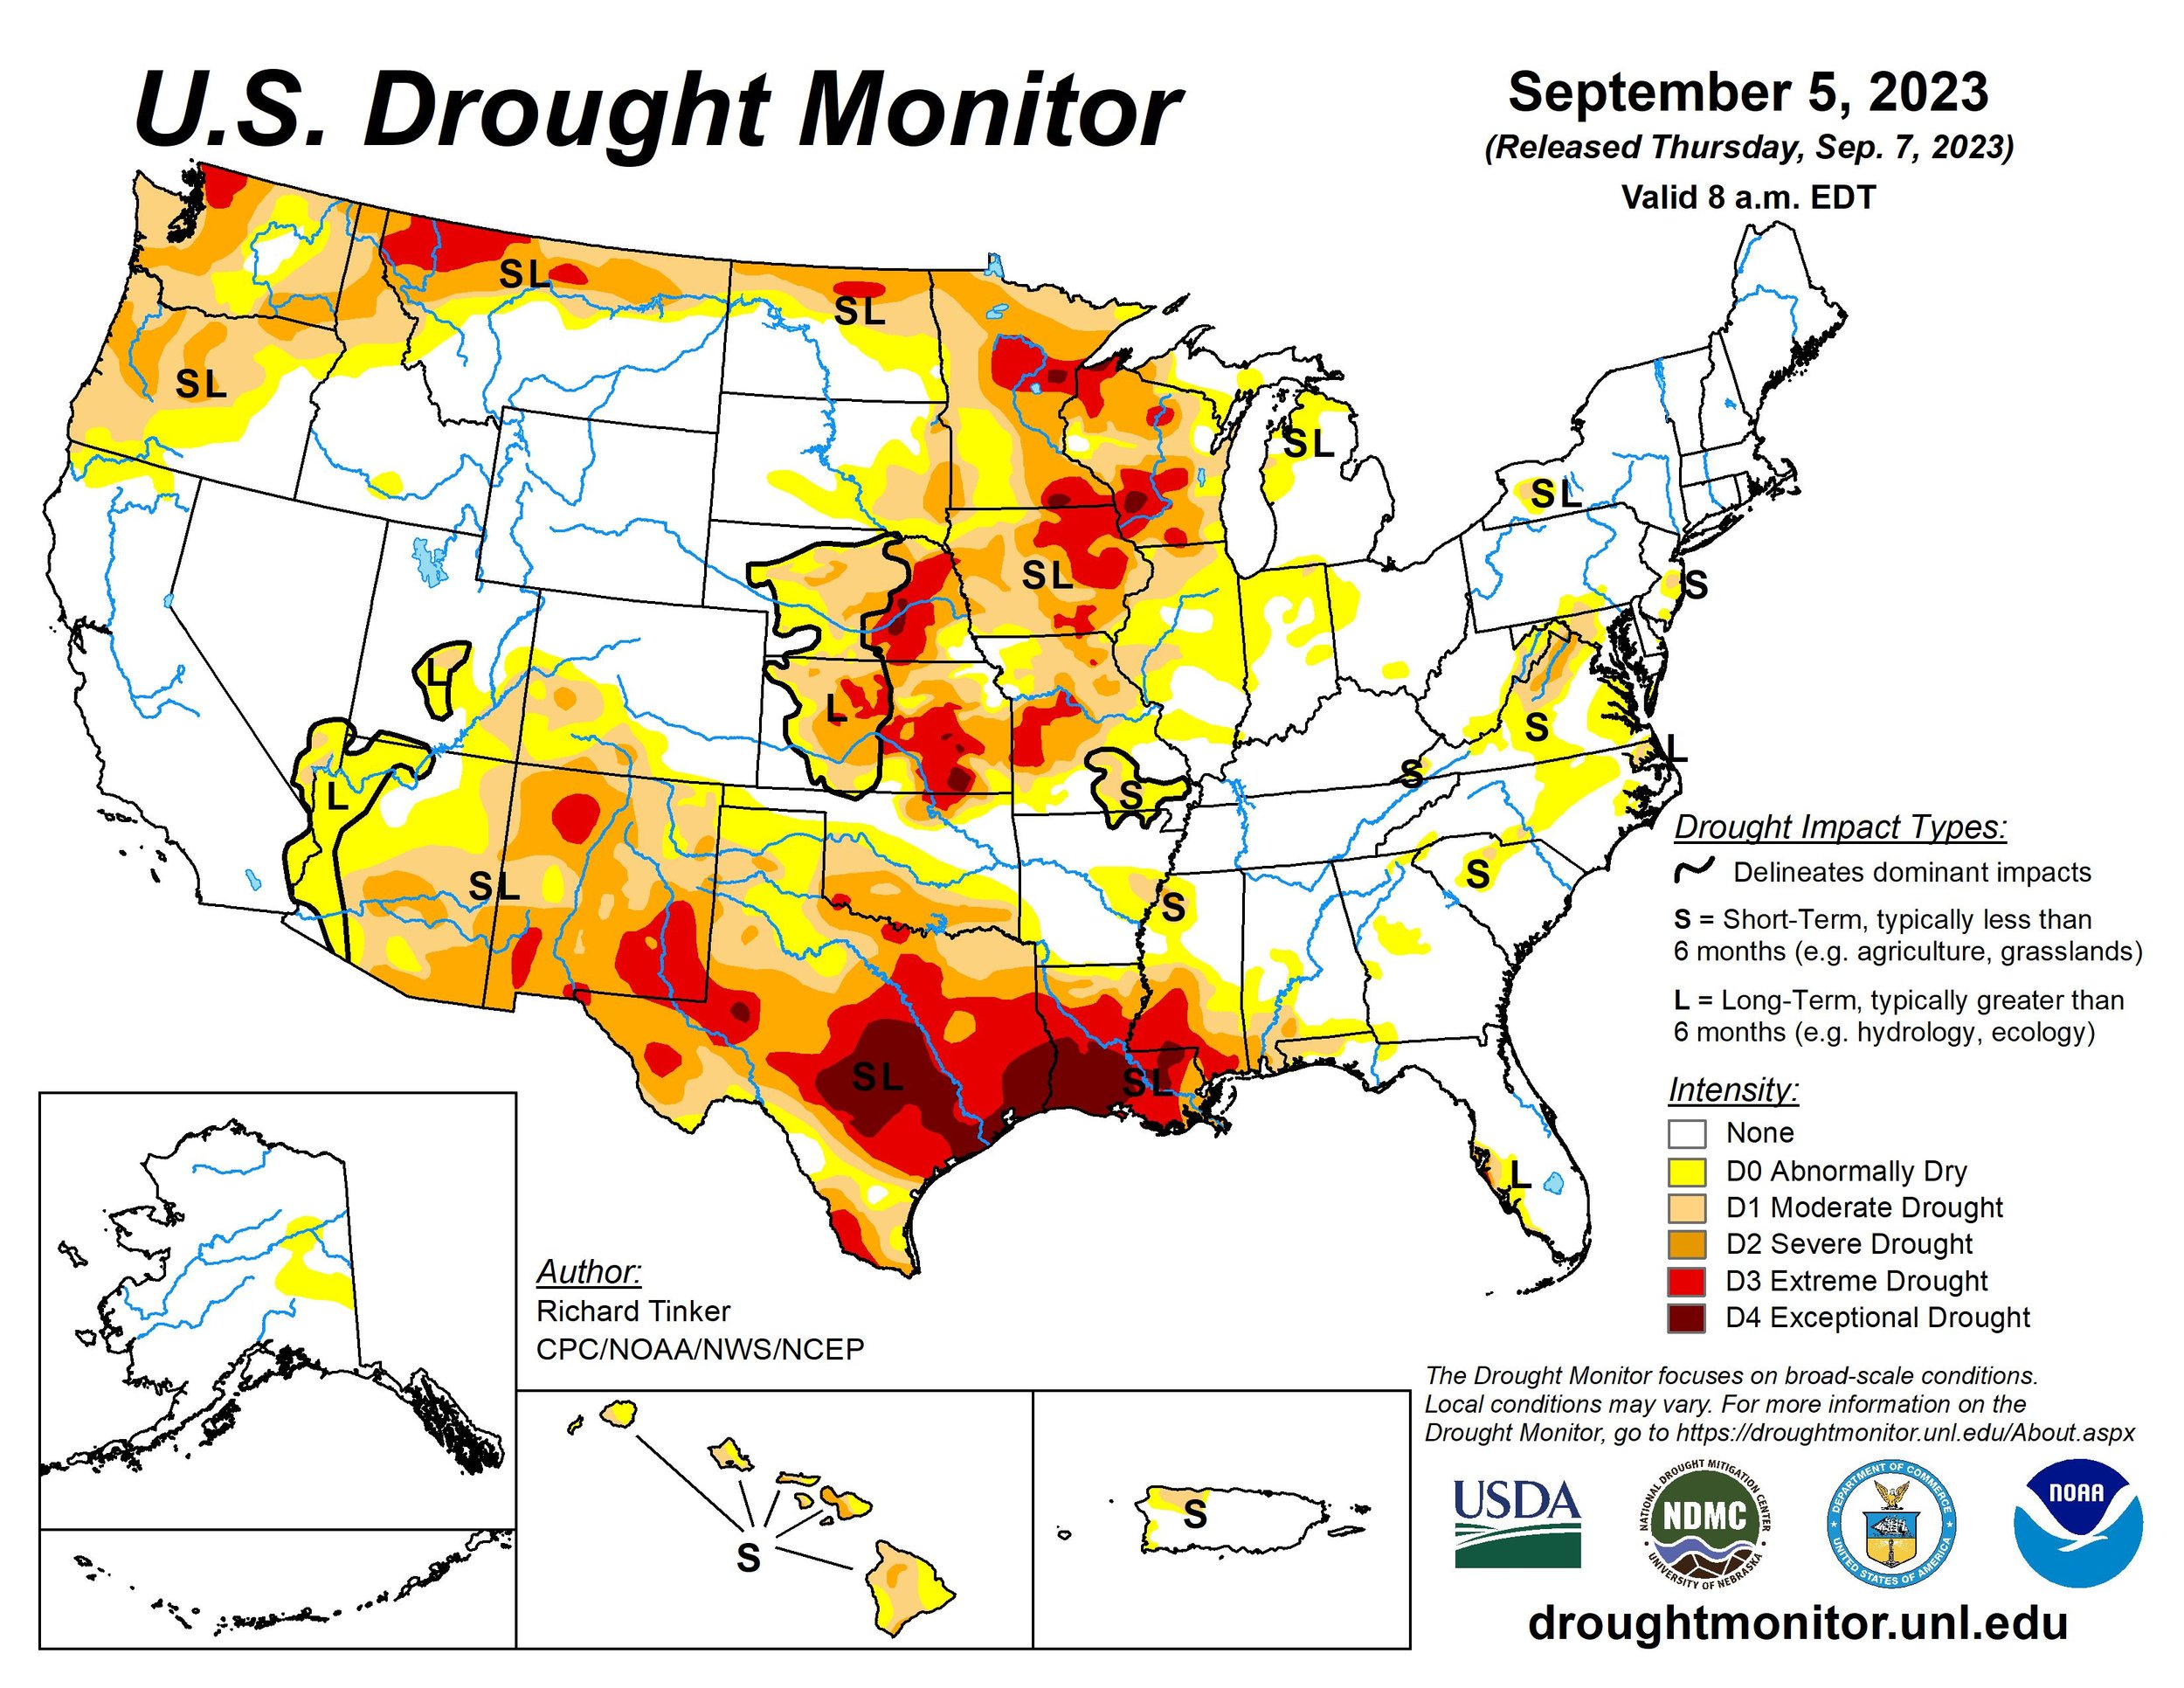
October Weather Summary: Temperatures across the state of Colorado were near-normal to slightly above-normal for the month of October. Precipitation was below average; some places in Colorado received less than 2% of normal. Swamp Angel Study Plot fell short of average with 9 days and only 59 mm (68% of average) of precipitation. Swamp Angel’s snow sensor has yet to be installed for the season. Drought conditions popped up in the west/southwest part of the state. However, it was a snowy Halloween! El Niño conditions have everyone curious about what kind of snow year might be on the horizon, forecasted at 100% probability of continuing through February, and 80% through the whole winter into May. Next month is forecasted to be warm, with a 40-50% chance of above normal temperatures.
November Weather Summary: November was dry and warm, especially in eastern Colorado. Drought conditions increased to cover 14% of Colorado, deepening in the southwest and developing in the eastern plains, with the Rio Grande River Basin developing extreme (D3) drought conditions. SASP saw two winter snow storms - an average eleven days with precipitation, yet only about 63% of normal precipitation. A strong El Niño continues; let’s hope things kick up.
December Weather Summary: December led with a hefty winter storm, improving Colorado’s statewide SWE from 54% to 85% of normal following one big storm. As the rest of the month progressed, there were a few fun pockets of big snowfall in the state, lots of low-angle pow out in the eastern plains. Just like there were pockets of much above average, so were there pockets of below average. Colorado snowpack didn’t much recover in the end, with about 70% of average SWE to round out the year. Statewide, the year ended with the 6th straight warmer-than-average month in Colorado. Drought expanded again in Colorado slightly, continuing in the southwestern and eastern parts of the state. There is an 80% chance of El Nino continuing through spring, when neutral conditions may start to take over. Some hopeful news: NOAA seasonal outlooks suggest above average precipitation for all of Colorado from January through March. For Swamp Angel Study Plot (SASP), December saw about half as many winter storms as is normal, below average days of precipitation, and about 73% of normal precipitation. And, we got the snow depth sensor re-installed and running at Swamp Angel. At the end of the month, snow depth was 0.66 meters.
January Weather Summary: January’s snowpack was slightly resuscitated by a nice mid-month storm cycle, with multiple snowstorms bumping statewide SWE to 87% of average by the end of the month. The Upper San Juan River Basin bumped up to 78%, and with the lowest SWE of the state, our neighbor the Rio Grande at 66% of normal. Statewide precip was close to average, though there were extreme differences in distribution: the southeast corner of Colorado saw much-above average precipitation, and the Grand Junction area was very dry. Here in the southwest we saw warmer-than-average temps. January became the 7th straight month that was warmer than the 20th century average. NOAA seasonal forecast suggests increased probability of above average temperatures for Colorado, from 33 to 60% above normal. 28% of the state remains in drought, with the worst conditions in the southwest. At Swamp Angel, we had an above average January (yay!) with 4 winter storms, 18 days of precipitation, and 138mm of new SWE (119% of average). SASP snow height started the month at 0.66 m and ended the month with 1.13 m – a respectable half meter gain in total snow depth. El Nino continues – there’s a 70% chance of El Nino continuing through spring (March-May). Precipitation outlook for February supposedly above average.
February Weather Summary: The Front Range, and the eastern plains from north to south saw a bountiful February with areas of 200-400% of normal precipitation - our San Juans didn’t do too bad either. We made gains to 91% of average snowpack by the end of February, with all of Colorado sitting at 97%. Regional temperatures slightly-above to above normal in February for most of Colorado. Streamflow volume forecasts look to be near-normal to below normal April-July. Colorado saw some drought improvement, but the southwest is still hanging out in the D0-D2 categories. El Nino continues and there is an 80% chance of these conditions continuing during March, though start to expect a transition to neutral. March could bring above normal precip, the NOAA precip outlook suggests. In February, Swamp Angel had 3 winter storms, 14 days of precipitation, and 125 mm of precipitation. With near-average storm count and days of precipitation, the storm totals added up to 112% of average February precipitation. At SASP, snowpack increased about half a meter, and at Senator Beck, we gained 30 centimeters to a height of 1.2 meters. The end of February brought a nice snow storm with a not-so-nice dust layer. Dust was pretty light in severity at Swamp Angel.
March Weather Summary: March delivered! Much of Colorado received greater than 150% of average precip, though pretty dry (and hot) in the southeastern plains. Mostly, temperatures were normal to below normal throughout the state, but warmer pockets existed. Statewide SWE conditions jumped to 112% of average in Colorado. The March snow lightened drought, improving conditions in western Colorado and eliminating drought conditions in northern Colorado. Another dust event swept in March 2-3 and ended up pretty widespread, as the winds have kicked up as well. The San Juans were hit pretty hard; we saw decreasing severity in dust heading north. However, a March 13-15 event brought lots of snow to the state, burying that dust layer for later - daily snowfall records were broken in Canon City, Colorado Springs, Estes Park, and 25 more (28 sites total). Swamp Angel totaled 4 winter storms, 17 days of precip, and 120 mm of precip. A few extra days of precip than average, and about average precipitation (104%). Snowpack peaked at 1.99 m March 26th. On a large scale, ocean temps are cooling, and by early fall, we have a greater than 60% chance of La Nina conditions developing.
April Weather Summary: Colorado concluded April with a snowpack (SWE) averaging 92%. Precipitation lagged throughout most of the state, though a good chunk of the northeast was an exception. Here in the southwest we saw below average precip, and 0-4 degrees F above average for temperature. Our respectable April 1st snowpack took a hit throughout April. The April CODOS tour found the most severe dust layer lingering 1-2 feet under the snow surface. The second layer however, is under approximately 5” of recent new snow accumulation in the eastern and northern sites, and at the surface in the southern sites. SNOTEL data showed nosedives in SWE in southern sites starting sometime in the second week of April, scant storms and warmer temperatures didn’t help mute the dust on the snow surface. Northern Colorado river basins are faring better for snowpack, with near normal conditions. Southern Colorado river basins are lagging, around 70% of normal. South-central Colorado saw improved drought conditions, while southeastern Colorado drought worsened. Swampy’s snowpack lost 65 centimeters in April, despite 3 winter storms, 12 days of precip, and 75 mm of precip. Only 68% of average precip for the month.
May Weather Summary: Across Colorado, May temperatures were cooler than average, a nice preservative for our snowpack. Some lucky parts of Colorado even saw lots of new snow, though the Southwest was left out of the fun. With a chill May comes above-average regional SWE - 136% for Colorado. Seasonal temperature and precipitation outlooks (NOAA) for the summer are showing below average precipitation and above average temperatures, not what we like to hear but let’s hope for the best. Swamp Angel Study Plot received 77% of average precipitation, and sat at about 87% of average year-to-date cumulative precipitation at the end of May. It looks like our snowpack fully melted out around June 2nd.
June Weather Summary:
The monsoons looked to be delayed, yet precip was a’plenty in the latter half of June. The rains just kept coming for Southwestern Colorado. Yet, this moisture was not the North American Monsoon – in fact, it was the rather quick transition out of El Niño into ENSO neutral conditions, which resulted in strengthened jet streams and moisture from the Gulf. And, it was warm – temps above normal for much of June. Heavy rainfall hit Swampy – with six days recording precipitation in June, total precipitation was 129 mm or 385% of normal. Silverton was wrapped up in misty clouds for days at a time.
Below: Images to help illustrate WY2024 dust-on-snow conditions.


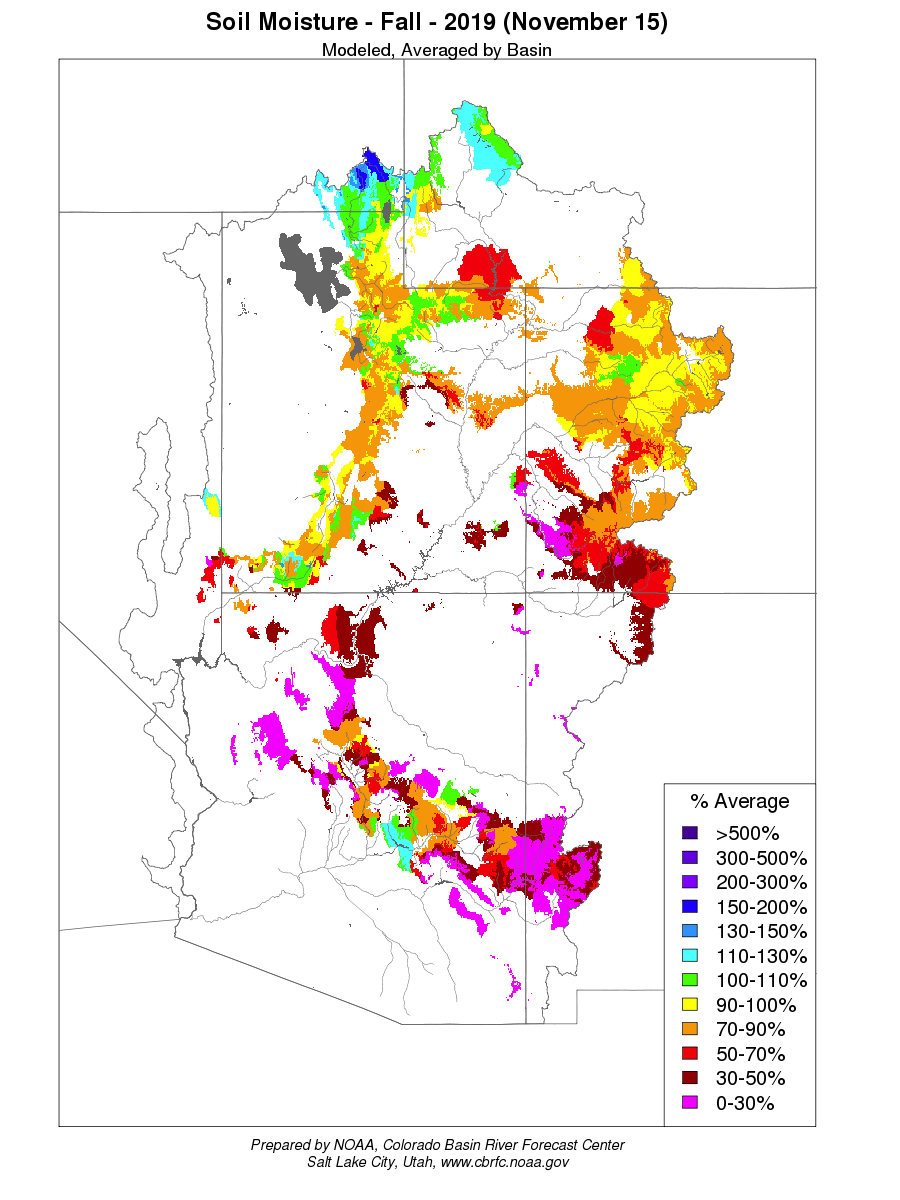
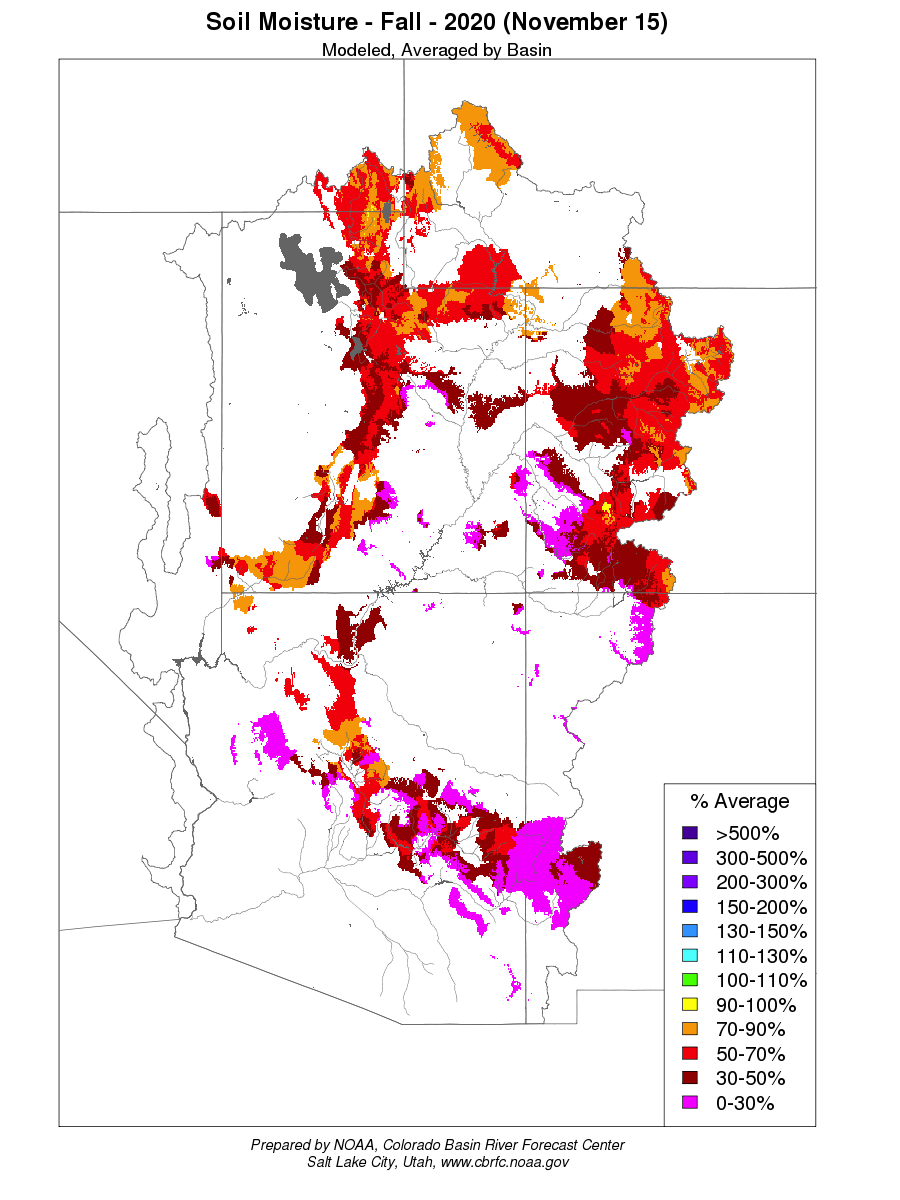
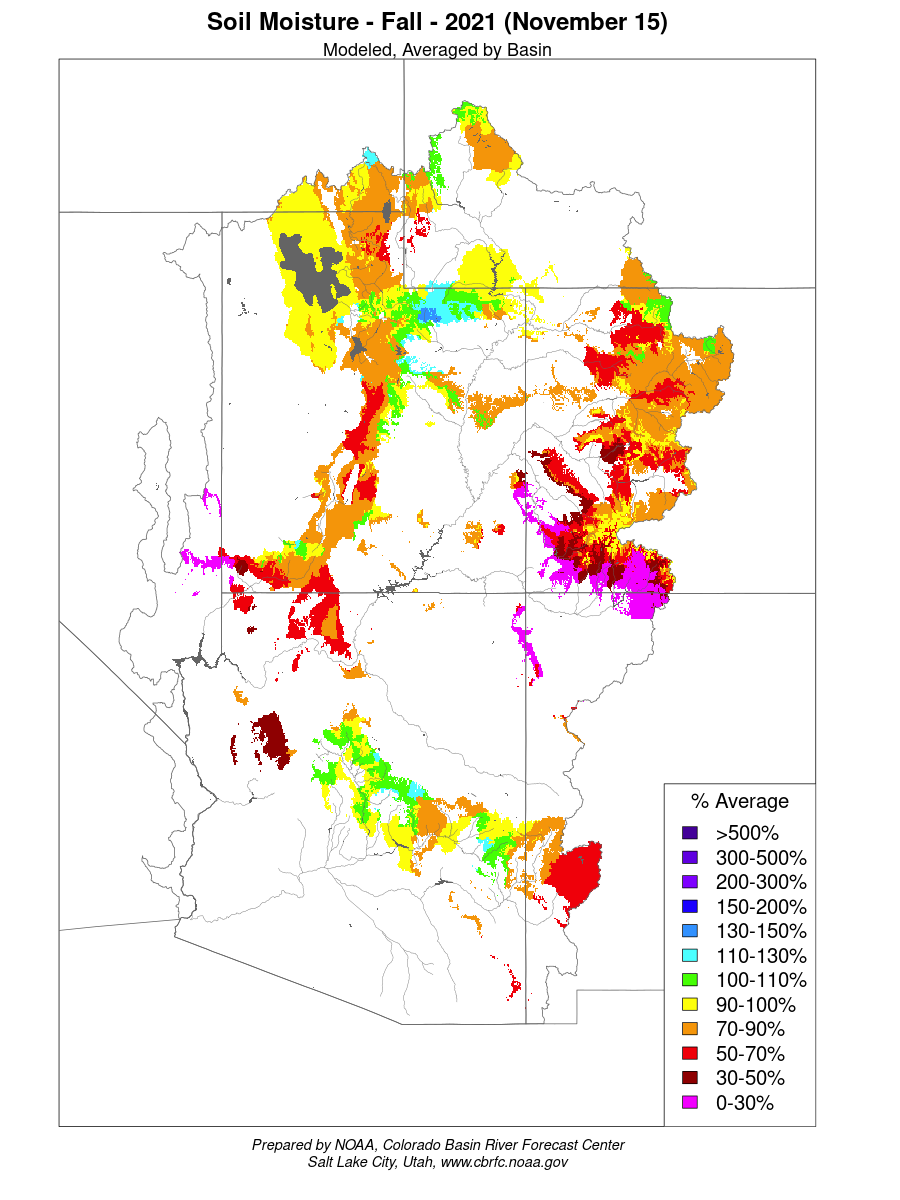
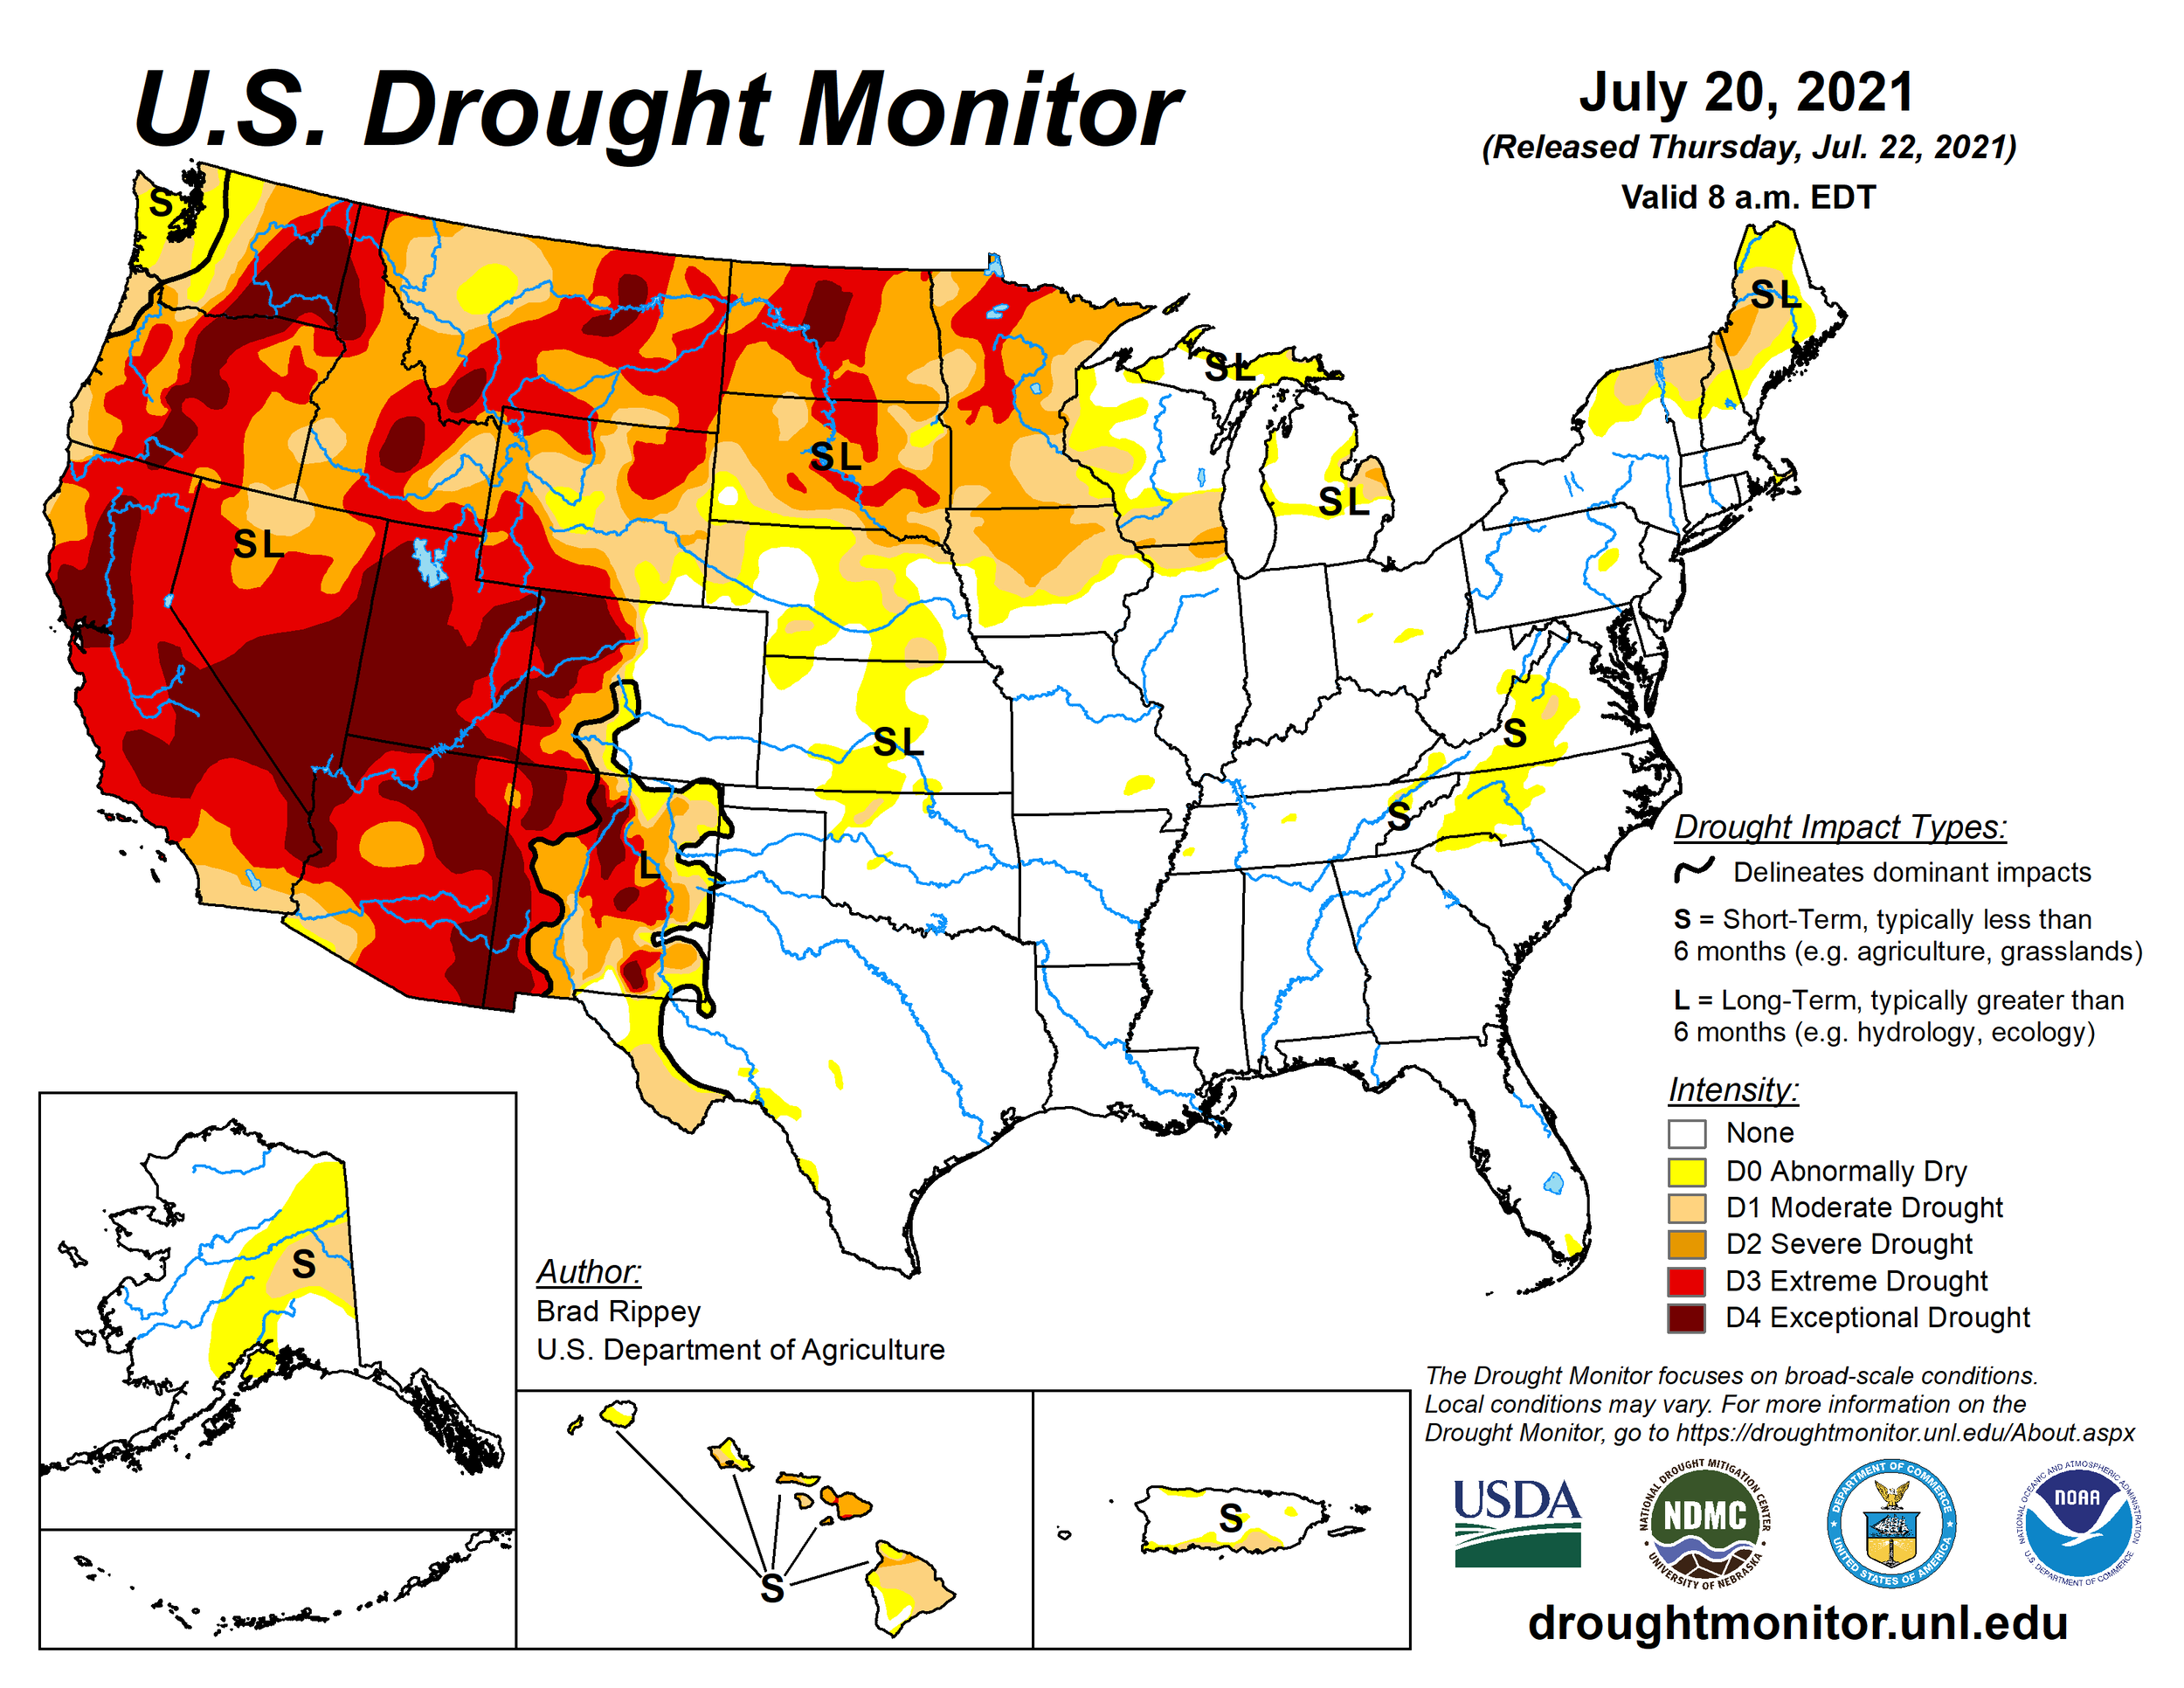
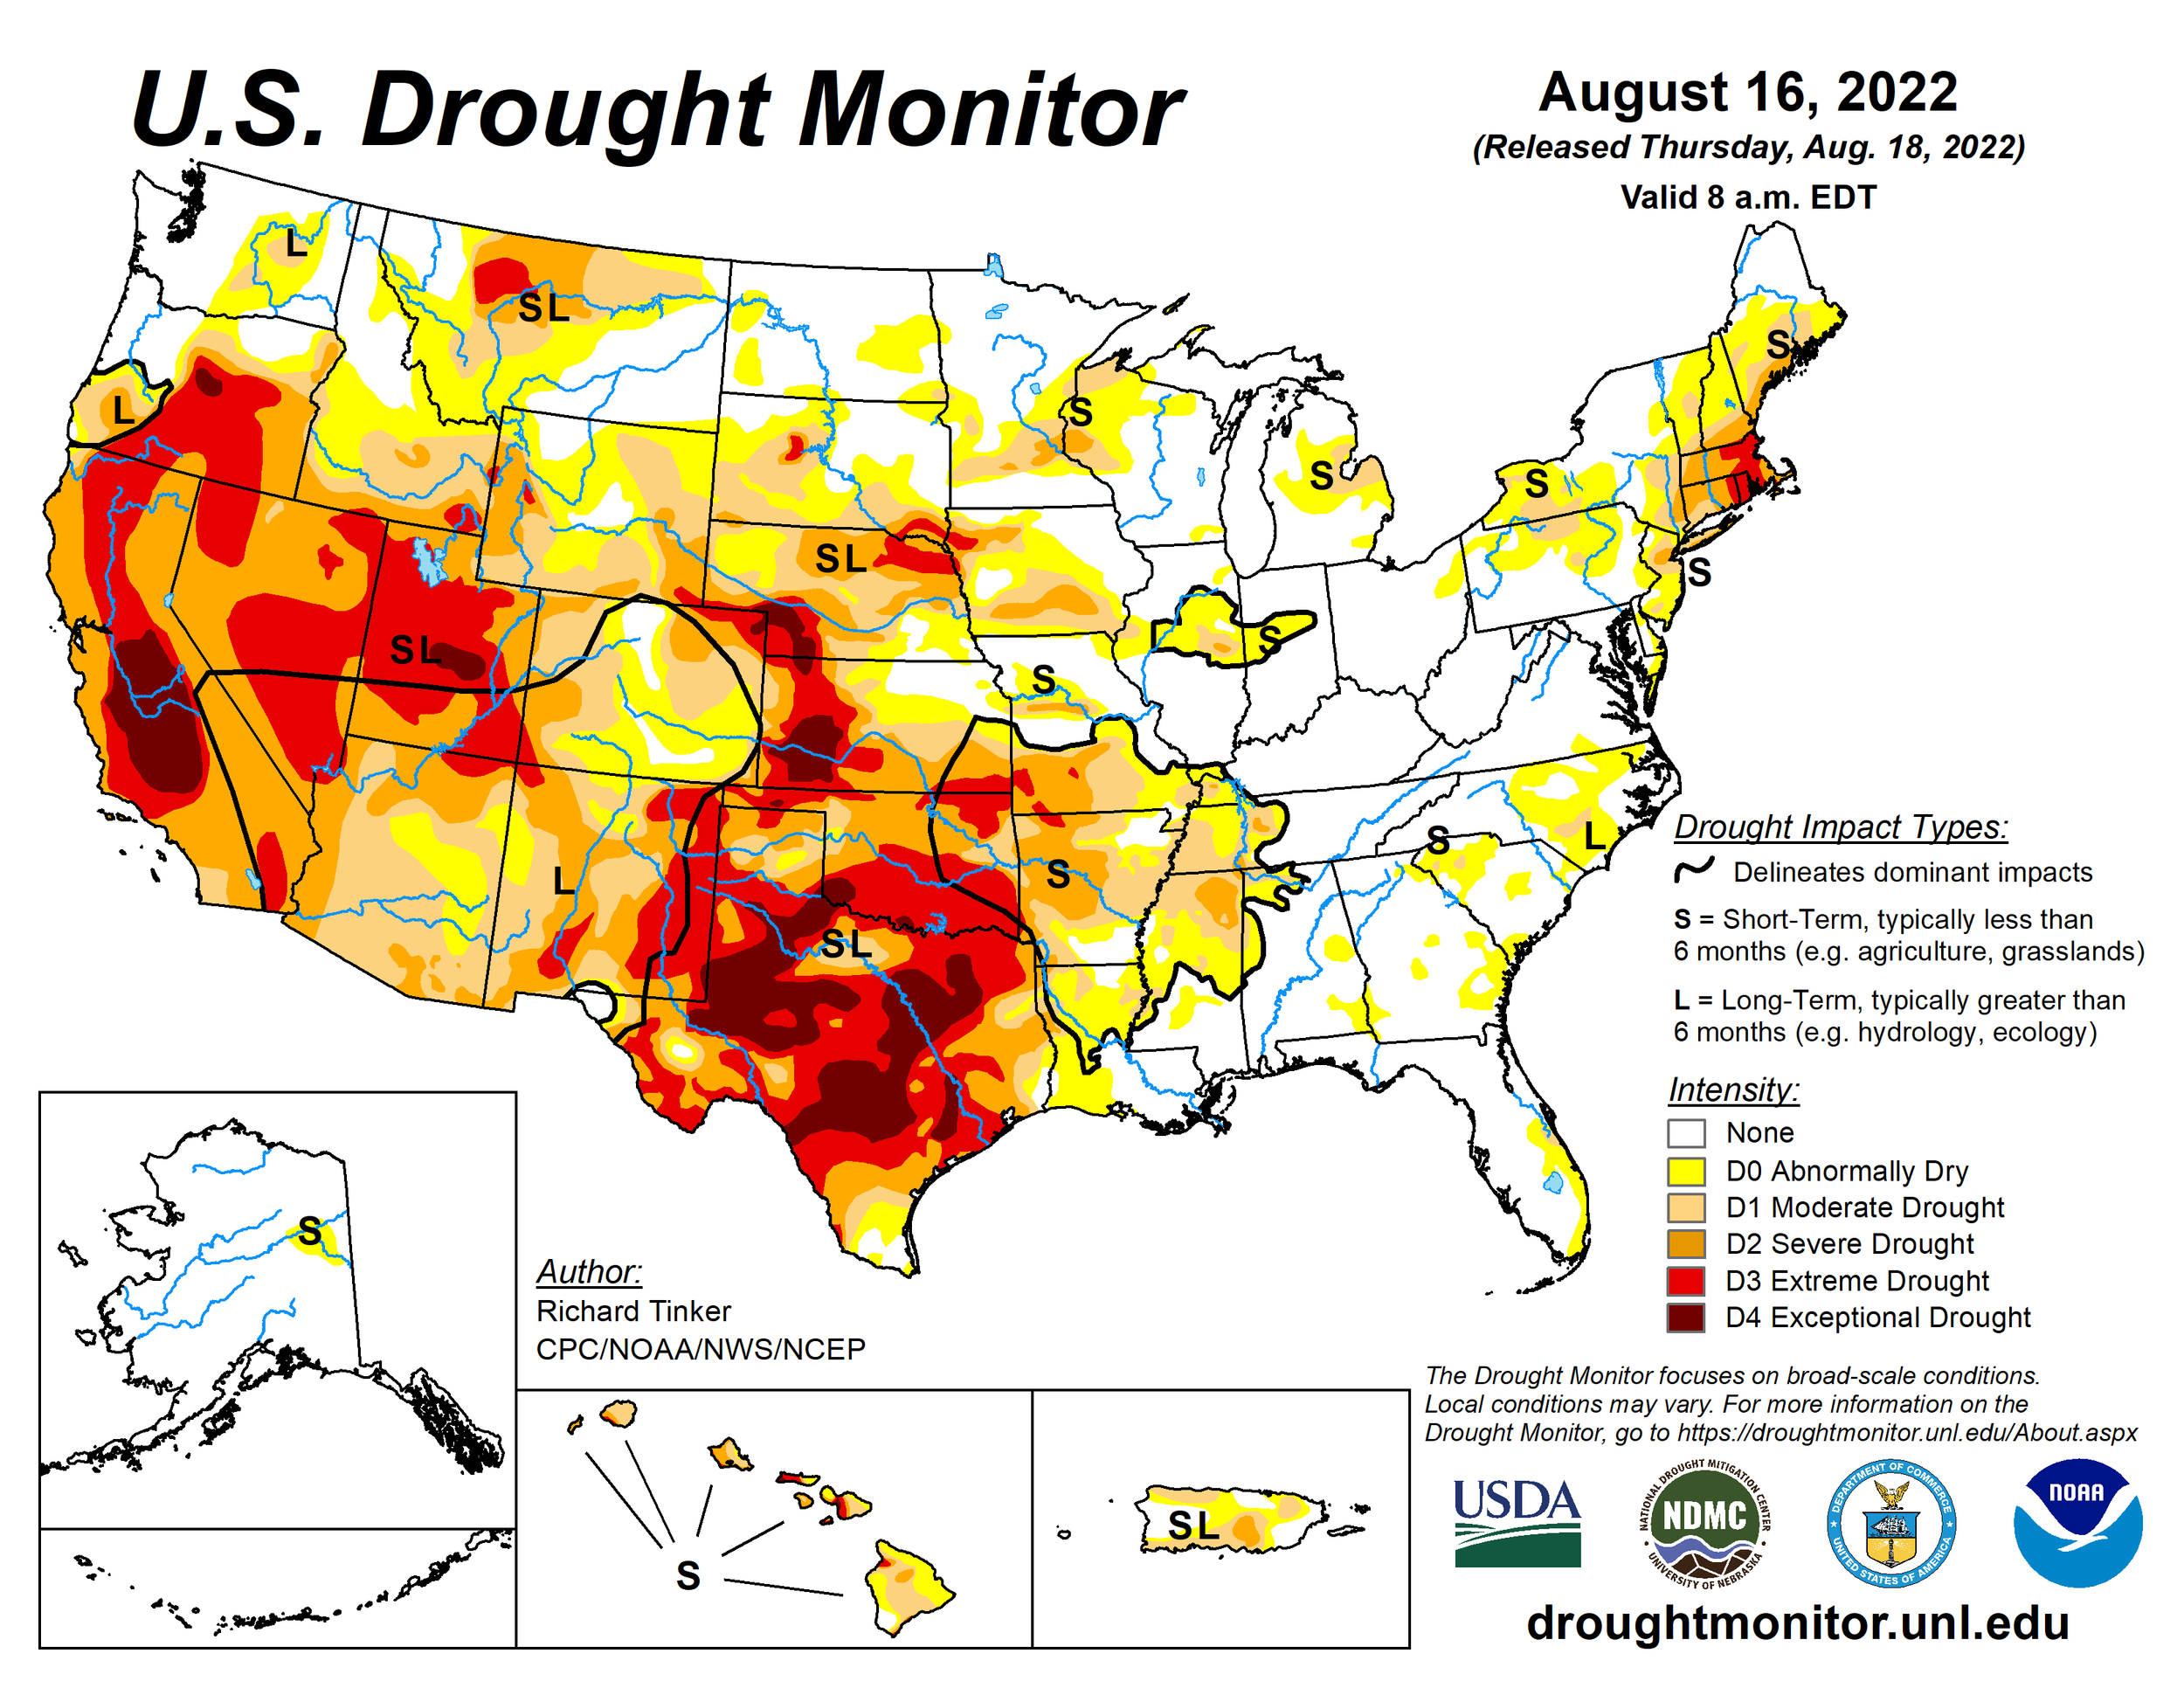
Below: Soil moisture conditions going into winter for the last four years. The beginning of WY2023 soil moisture was better than the previous few years due to improved monsoon activity and a few early season storms. Healthy soil moisture conditions generally improve the likelihood of more efficient snowmelt runoff.


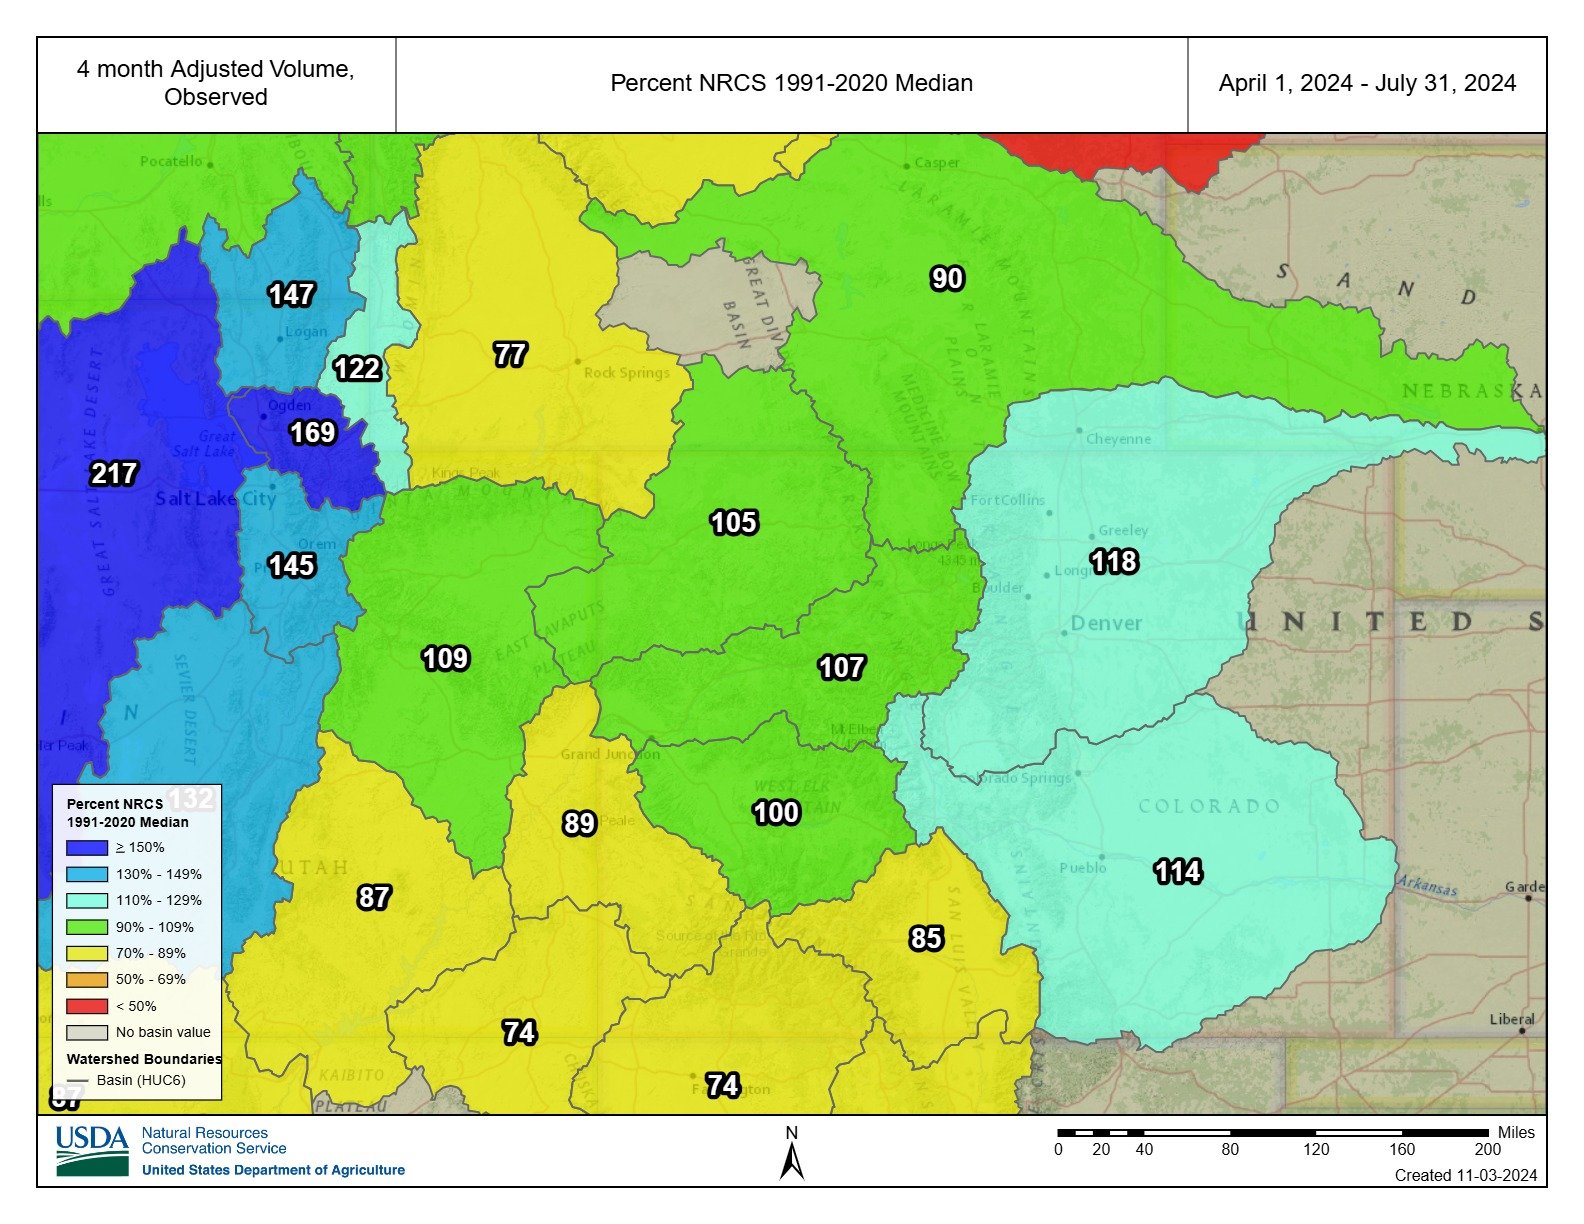
Above: From the outset of water year 2024 precipitation and snow accumulation started off solidly and kept improving as the season progressed. Most major basins saw 150%-400% of normal precipitation in March. The summer monsoons were very late in arriving (mid-August as of this writing) have recently become more active, particularly Southwest Colorado. June was very wet in the entire Southwestern quadrant of Colorado. The Front Range enjoyed a pretty wet June and well-timed rain events in July/August, enough to keep vegetation mostly green, a nice change from recent summers.
SENATOR BECK STUDY BASIN DATA
This section describes conditions and data collected by the Center for Snow and Avalanche Studies at our Senator Beck Basin Study Area (SBB) at Red Mountain Pass under our Mountain System Monitoring program, which includes the Colorado Dust-on-Snow Program (CODOS). At SBB, snowpack, weather, soils, and radiation conditions are monitored and measured at the well-sheltered subalpine Swamp Angel Study Plot (SASP, 11,060’) and at the more exposed, alpine Senator Beck Study Plot (SBSP, 12,180’). Nearby, wind speed, wind direction, air temperature, and humidity data are collected at the Putney Study Plot (PTSP, 12,323’), located to minimize the influence of local terrain on those measurements. Finally, SBB streamflow discharge is continuously measured at the SBB pour point at the Senator Beck Stream Gauge (SBSG, 11,030’), in a broad-crested, notched weir.
All total we received 20 storms, just under average for our season. A storm is defined as receiving 12 mm (0.5”) or more of precipitation with no break in precipitation greater than 12 hours. Winter storm reports can be viewed at the snowstudies.org website.
The above graph shows precipitation at SASP with snow depth at SASP and SBSP. Our snowpack was lagging at the beginning of the season, not really catching up until January. After January, we had a series of consistent storms that brought enough moisture to carry us through. You can see the rapid melt at the end of April due to dust at the surface and really warm air temps, with a big dip in snowpack depth, and a plateauing as May ushered some cooler temperatures and precipitation. In June, we received some heavy downpours that bumped our precipitation for the month over 300% of average.
Above: Water Year 2024 cumulative precipitation.
SNOWPACK CONDITIONS
This Colorado snowpack season was a mix of conditions. This winter was characterized by a string of warmer-than-average monthly temperatures, while precipitation was slow to start though began to consistently roll in by mid-season, though amounts varied in extremes throughout the state. We saw a big melt event end of April, but recovered slightly in May and June. Streamflow outlooks were generally low until mid/late season storms pushed many above average.
Starting in October, precipitation was generally below average across Colorado to start the season, with exceptions of a few pockets in the central mountains. A Halloween snowstorm dropped 8-24” of fresh flakes on the central mountains, marking a nice start to November. From there, precipitation stalled; only certain areas of eastern and southern Colorado saw lots of December snowfall. At Swampy, our snowpack accumulation dragged until January, when that nice mid-Jan storm cycle brought our precipitation totals over average, with 18 days and 138 mm of precipitation. That string of storms in the middle of January brought many watersheds up to near-normal in a short period of time. On January 1st, the Upper San Juan basin averaged just 61% median SWE, the Gunnison River basin 71%, and the Colorado Headwaters averaged 68% median SWE. By January 15th, the Upper San Juan basin jumped to 86%, the Gunnison up to 94%, and the Colorado Headwaters averaged 97% median SWE. February is not to be forgotten, with above-normal precipitation, and notably, a historic deluge of rain and snow on Denver and Boulder. February and March also brought above-average precipitation for Swamp Angel. At the end of February, we began clocking dust events starting with D1, a big windy dusty February 26-27 in the Four Corners region, which distributed a light dust layer visible in Senator Beck Basin. March brought statewide monthly temperatures near-average and continued the precip accumulation across the state, generally wet, which tapered off into a dry April. The heat cranked up in April, 0-4 degrees above average across the state. We saw historic losses of SWE at the end of April for more than a few SNOTEL stations. The beginning of May saw near-normal SWE conditions in the northern Colorado Mountains, and below-average percentages in the southern mountains. Notably, the Rio Grande was at 57% median SWE as of May 1st. May brought much needed cool temperatures and fresh precipitation, which resuscitated the snowpack from the end-of-April dive prompted by dirty snow surfaces and hot spring days. By June 1st, with the exception of the Rio Grande and the upper San Juan, the major Colorado river basins were between 107-165% median SWE. Snowpacks melted in June, and the rains began. June brought heavy rain to the Four Corners region, though other areas of the state were extremely dry. Our date of snow-all-gone was June 2nd, and the regional Colorado snowpack melted out June 23rd.


Above: Most Colorado watersheds attained an average or better snowpack by April 1st, and was added to by the plentiful snow/rain in June. The two basins that struggled the most was the South Platte and Arkansas, but nonetheless they attained a near normal peak SWE.


Above: Annual statistics for individual SNOTEL stations tracked by the CODOS Program.
Below: Summary statistics for individual SNOTEL stations.
Below: Summary data for WY2024 at the 16 SNOTEL stations that CODOS monitors. The table shows peak SWE, and calculated from the day of peak SWE, melt rates, days to snow-all-gone, and mean temperature. Hoosier and Park Cone won the prize at 123% and 130% of normal. Most sites were near normal. Red Mt Pass and Wolf creek came in on the low end.
Below: A summary of WY 2006-2024 snowmelt rates and associated conditions at the 16 SNOTEL stations that CODOS routinely monitors. Days to SAG refers to the time between peak SWE and “snow all gone” at the SNOTEL sites. Adjusted Daily Mean Loss calculates the rate of snowmelt following peak SWE, including all precipitation received after peak SWE (assumed to be snow). Melt rate tables are presented for each of the 11 CODOS monitoring sites on their webpages.
Group mean peak SWE was about average. The adjusted daily loss of SWE was on the low end. Days to snow-all-gone was in the middle of road.
Above: Snow depth at Swamp Angel Study Plot.
Above: Snow depth at Senator Beck Study Plot.
Above: Snow water equivalent at Swamp Angel from snow profiles.
Above: Snow water equivalent at Senator Beck Study Plot from snow profiles.
DUST-ON-SNOW CONDITIONS
DUST ENHANCED RUNOFF CLASSIFICATION:
In Water Year 2015 CODOS introduced a Dust Enhanced Runoff Classification (DERC) approach to linking dust-on-snow, snowpack, and spring weather conditions to patterns in statewide hydrographs within a 3x3x3 Dust Enhanced Runoff Space. The below table presents the final DERC classification of WY2024 parameters at each of the 20 stream gauges monitored by CODOS. Water Years 2006-2024 classifications are contained in Excel workbook Runoff_Space_by_Region_and_WY.xlsx. Another workbook, Runoff_Space_by_Watershed.xlsx, contains individual DERC analyses for WY 2006-2024 for each of the 20 stream gauges.
A conceptual Dust Enhanced Snowmelt Runoff Space integrating the interactions of March 1 SWE, dust intensity, and spring precipitation.
Current and prior seasons snowpack conditions, dust severity, and spring precipitation are mapped for individual DERC space along with the hydrographs. These analyses are presented in PDF format and are available for the watersheds listed below. Referencing these DERC spaces in spring is helpful to get and idea how spring runoff will possibly unfold.
Below: Based on the discussions describing the DERC approach in characterizing the watersheds that CODOS monitors, WY2024 snowmelt season conditions are summarized in the tables below. Essentially, Colorado WY2024 snowpack and snowmelt runoff behaviors were mostly average with a number of wetter and drier areas. Dust severity was about average throughout Colorado but a relatively wet spring largely kept dust on the snow surface covered pushing runoff towards a more normal time period.
The Senator Beck Study Basin received 5 dust events this season, they occurred on February 26-27, March 2-3, March 30-31, April 5, and May 4-5. At the end of February (D1), we got reports of winds picking up around the Four Corners region with hazy skies and sand dunes developing on the roads, so we were expecting the dust that settled on the snowpack. Up at Swamp Angel, the dust was relatively light in severity and landed with about 8.5” of snow accumulation. However, the winds only strengthened and on March 2-3rd (D2) we had a much bigger, more widespread dust “wallop.” This wallop happened right at the start of the melt season, and while the storm also brought in some more snow accumulation, there was no doubt it would affect the remainder of the snow season. Our CODOS tour on March 15th found a wide range of variability in the dust layers. The San Juans from the Dolores to the Rio Grande were hit hard, with decreasing severity from Hoosier Pass north to Loveland. The dust was very mild at Grand Mesa and Park Cone, yet severe at McClure Pass and the Roaring Fork region. New precipitation buried the D2 dust layer under about a foot of snow at Swamp Angel. Our third dust event around March 30th (D3) was light with light precip, and a week later a bigger wind storm ushered in our fourth, April 5 (D4), which was initiated in the Four Corners region with sustained high winds from April 5-7th. D4 settled 4.5” below the snow surface at Swamp Angel (we dug a pit on April 9th). Our April CODOS tour happened on April 22 and found some consistency among the dust layers throughout the Colorado Mountains. D1 and D2 merged and were found approximately 1-2’ under the snow surface. The second dust layer, D3 and D4, was under approximately 5” of recent new snow accumulation towards the Eastern and Northern sites, and at the surface towards the Southern and other shallow snowpack sites (McClure, Spring Creek, Park Cone, Willow Creek). At this point in April, we began to see sunny, clear weather, and big time melt, setting new SNOTEL records on 14-day loss-of-SWE events. The dust was average except for the Roaring Fork region where it was severe. Luckily, May brought cooler temps and precipitation. On the 8th of May (D5), our last dust storm of the season was brought in with 100 mph winds at Putney Station and more precip. Our May CODOS tour was conducted right after a fresh blanket of snow, where we saw recovery in many regions despite a blistering end of April. The fresh snow in May kept the dust buried for a bit longer, prolonging our nice near-average conditions for a few more days, but soon the dust layers surfaced and remained there for the rest of the melt. By June 1st, melt was in full swing with streamflow rising.
Above: Total dust-on-snow events by month. March begins the more intensive part of dust-on-snow season. In WY2024, we saw dust events occur February 26-27, March 2-3, March 30-31, April 5, and May 4-5
Above: Total dust-on-snow events by year. Five dust events in 2023/2024 were “wet” events and none were “dry” events. Wet means the dust came in with precipitation. Dry means it arrived without precipitation.
Below: Snow season albedo since 2006. Albedo can vary greatly depending on dust severity and precipitation events. WY2024 (red line) was “upper-end-of-average” for dust severity conditions at Senator Beck. Precipitation events were rather frequent in spring which helped keep fresh snow (as well as cloud cover) on the surface and minimizing dust radiative forcing. The storms the beginning of June are seen in the albedo spike before going to snow-all-gone a few days later. Also in bold is WY2009 - a notoriously bad dust year - for comparison.
RUNOFF BEHAVIOR
Snowpack and dust-on-snow conditions set the stage for streamflow come springtime, and weather conditions dictate how it unfolds. This season, a notably dry, sunny, end of April played a big part kicking off the spring snowmelt across the state. On our April 22nd CODOS update, we noted that the most severe dust layer was around 1-2’ deep in the deeper snowpack. The second dust layer (D3 and D4) undoubtedly played a role in the end-of-April melt – in the northern sites, this layer was under 5” of recent snow, and in the southern sites, this dust layer was effectively at the surface. Nearly all the hydrographs we monitor in Colorado showed a spike in streamflow at the end of April, some bigger than others, and then we saw some differing behaviors mainly divided between the northern and southern river basins.
The northern Colorado rivers fared better recovering after the big SWE dive of late April 2024. While the hydrographs showed end of April streamflow spikes with varying degrees due to warm, sunny weather conditions and near-surface dust, they tapered at the beginning of May while the northern mountains received a significant amount of new snow and albedo reset, staving off the moment when the dust layers would emerge at the surface of the snowpack. On May 1st, percent SWE NRCS average of the basins were as follows: North Platte – 95%, South Platte – 103%, White-Yampa – 95%, Arkansas – 76%, Upper Colorado Headwaters – 91%. By May 15th, percent average SWE in these basins jumped to: North Platte – 115%, South Platte – 126%, White-Yampa – 109%, Arkansas – 118%, Colorado Headwaters – 108%. Most of the hydrographs from the northern basins showed peak flows above average around early June.
In the lower basins, the end of April SWE dive recovery didn’t play out quite the same. At the end of April, the Dolores, Gunnison, and Upper San Juan basins dropped from near normal SWE conditions to in the 60% of average conditions – a record loss of SWE, in part fueled by the surface dust layer we observed on April 22nd. By May 1st, conditions were: Upper Colorado/Dolores – 59%, Gunnison – 67%, Upper San Juan – 68%. May 15, the Gunnison River basin recovered to 89% of average, but the other two southern river basins did not. The difference was, the southern mountains just didn’t see the kind of added SWE needed to sustain flows and delay the emergence of the spring dust layers. After big melt spike in the hydrographs, the southern basins saw near-average to below-average streamflow peaks, and below average end of summer flows. The Gunnison river basin saw a good bump of precip early/mid May which kept flows up for a bit longer than the Upper San Juan and the Dolores. The Yampa River peaked at 4370 cfs on June 8, the Roaring Fork peaked at 1050 cfs on June 9, the Arkansas River peaked at 4710 cfs on June 10, the Dolores 1470 cfs on May 20, Animas was at 3510 cfs on June 7, the Gunnison peaked at 4210 cfs on June 9 and the Uncompahgre had multiple spikes of streamflow due to summers rains, higher than the snowmelt peak: 1370 cfs on June 28, 1440 cfs on August 12.
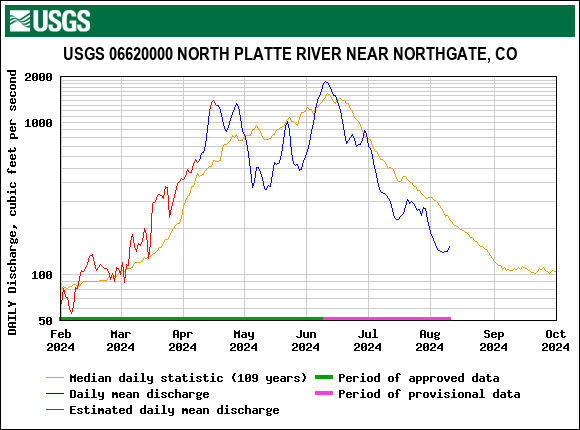
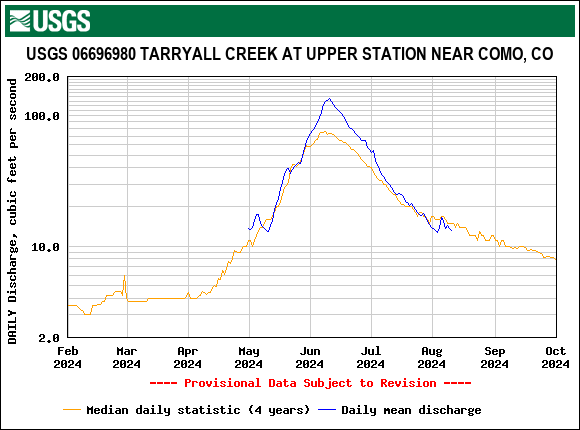
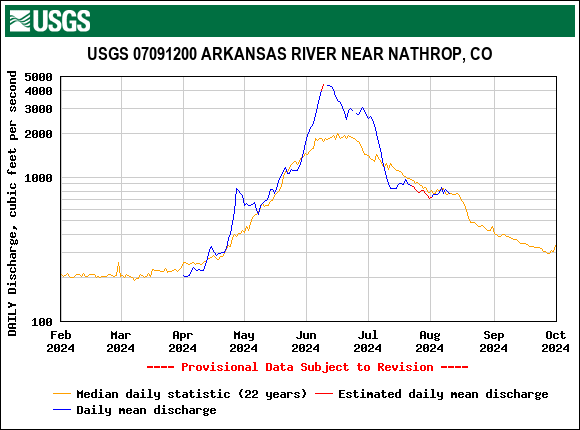
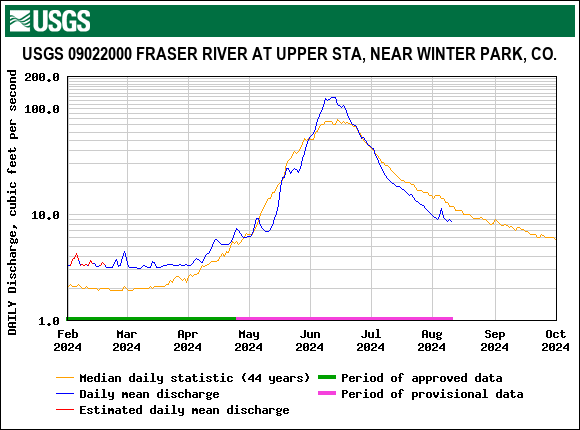
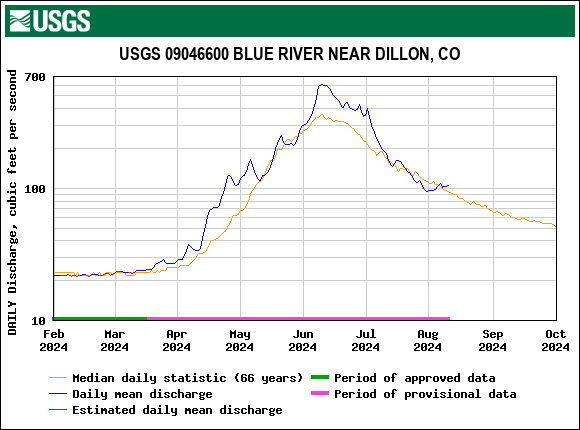
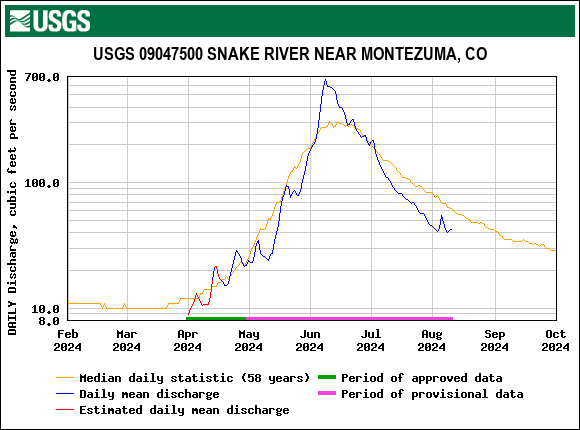
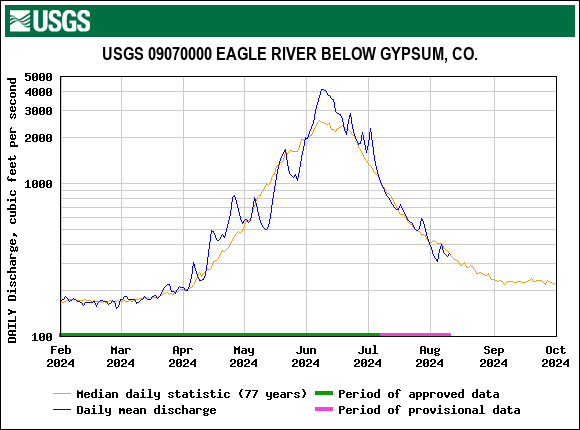
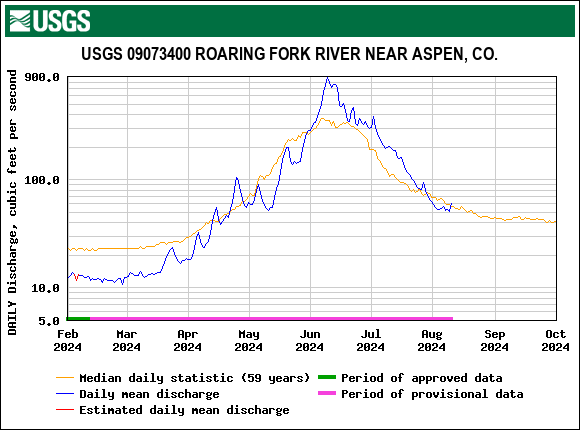
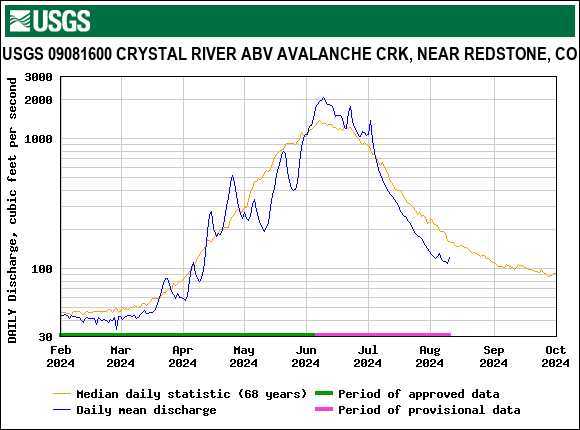
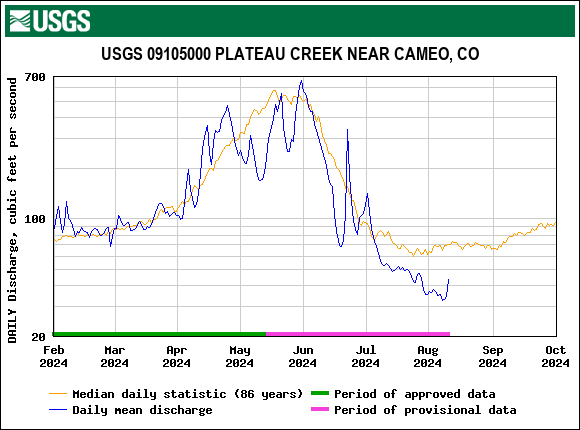
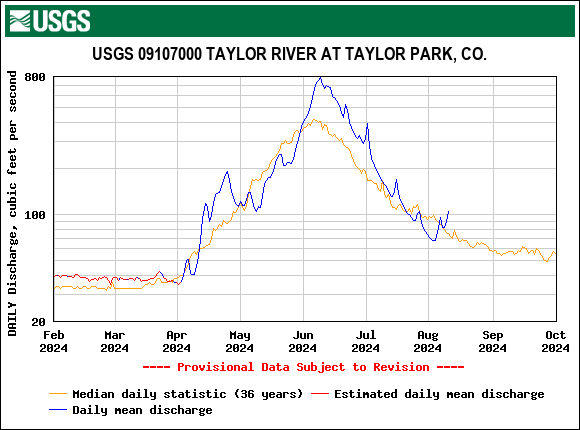

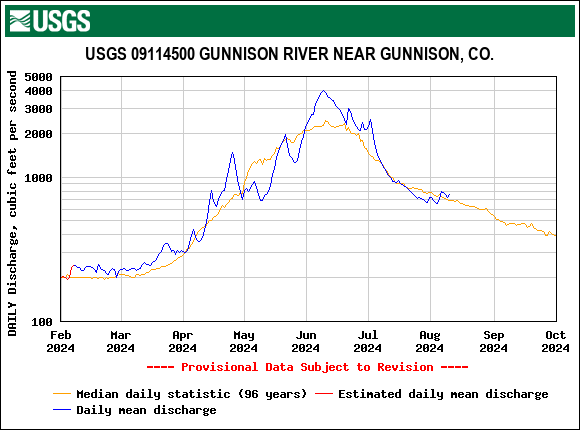
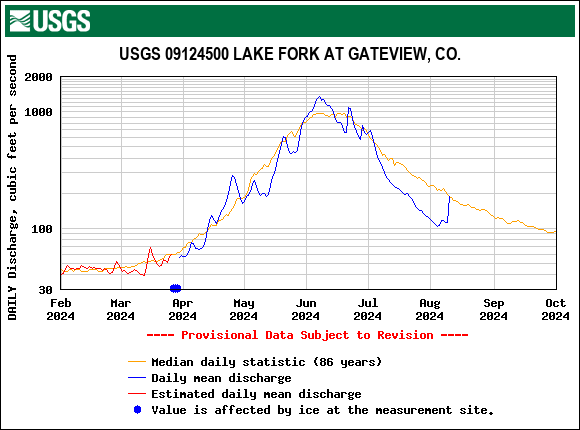
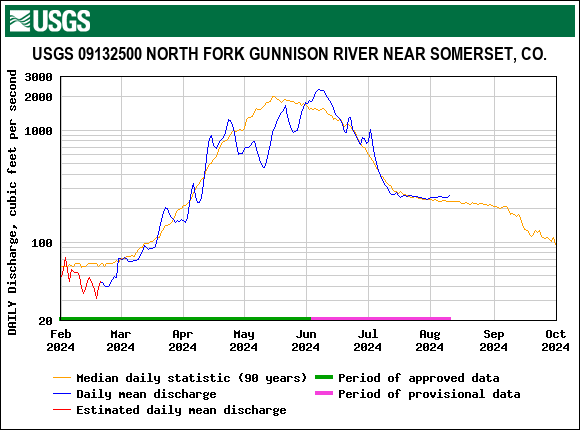
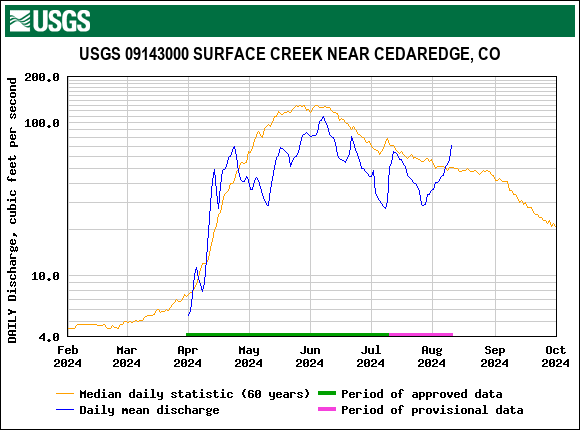
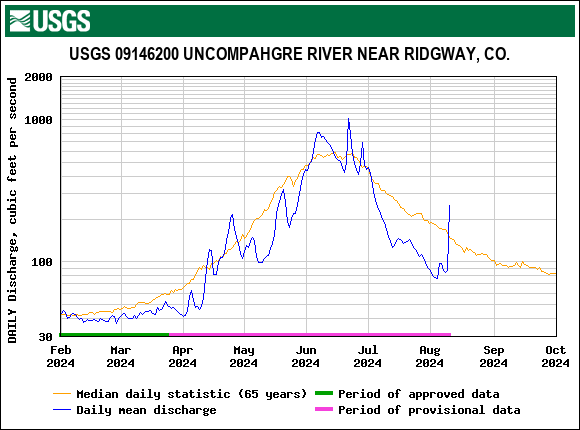
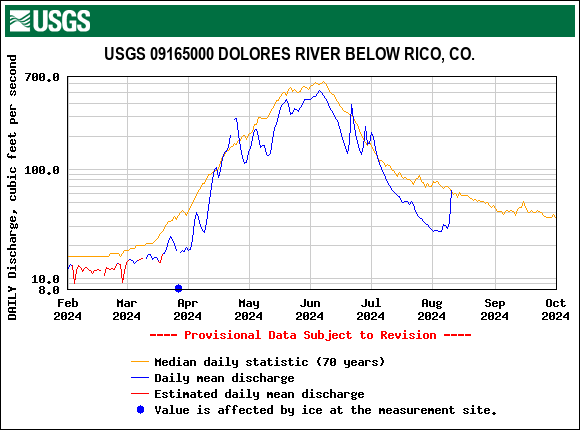

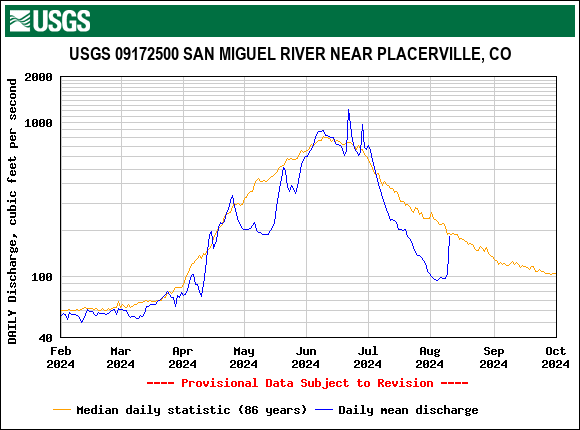
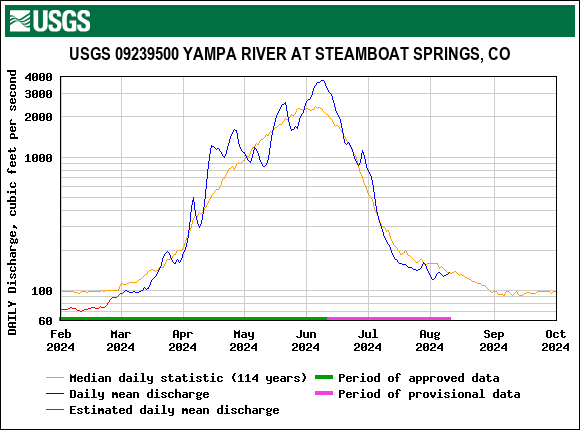
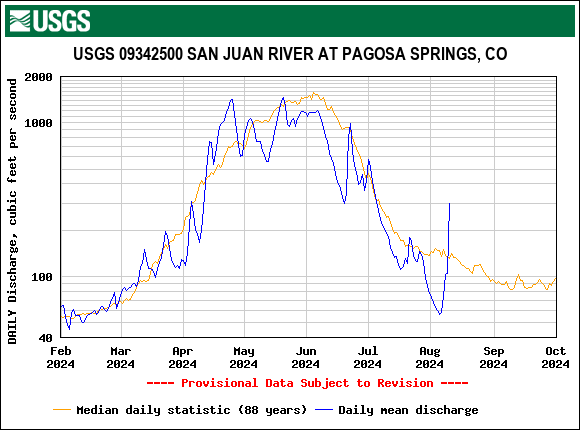
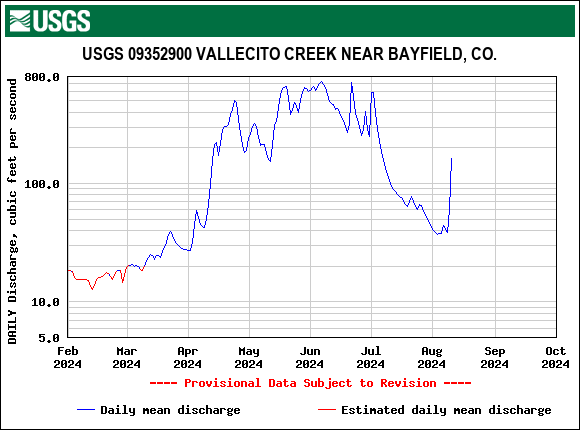
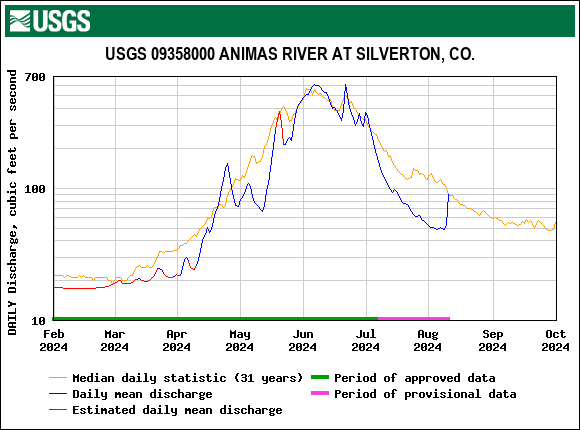
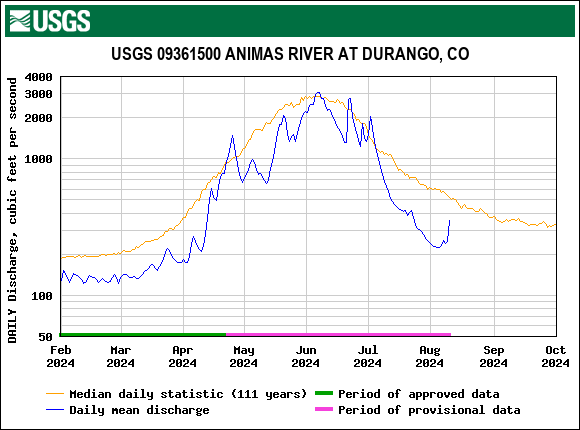
Above: It was a multi-peak season as recorded by many stream gauges. A large snowpack kicked into the melt phase rapidly due to a dry and sunny April fueled by lots of dust on the snow surface. Added to this, wet (snow and rain) conditions brought more water to the mountains, at the same time dampened snowmelt rates due to hampered incoming solar radiation, all made for complexities that made it more difficult to forecast timing of streamflows.
Peak discharge at Senator Beck stream gauge was June 6, reflecting the ~11,000’ elevation zone melt out, and June 22 for the high elevation, above 12,200’ melt.
Above: Correlation of snow-all-gone at SASP and peak Q at the adjacent Senator Beck streamgauge. All the severe dust years in red show SAG and peak discharge before June 1. Low dust years are shown in blue and average in green. The two years in green at lower left make sense as this was 2012 and 2018, two notorious low snow years (and dust severity was “upper-end-of average” for 2018).
Below: There is less correlation of the second streamflow peak Q with SAG at Senator Beck Study Plot (12,200’) compared to SASP but still very informative.


Above: Stormy periods in spring made for extended high flows rather than just one major peak. Peaks occurred approximately May 18, May 26, May 30, June 7, and June 22. The plentiful snow and numerous albedo resets in June kept snow in the higher elevations further into summer.
Looking Ahead
As usual, we all want to know what ENSO conditions are like – it’s a nice, familiar way to start trying to make sense of this coming winter’s forecast, despite its unreliability. From the NOAA blog, a nice reminder of the ENSO basics: “Rising warm air in the tropics is what drives global atmospheric circulation, and therefore the jet stream, storm tracks, and resulting temperature and rain patterns. ENSO’s varying sea surface temperature changes where the strongest rising air motion occurs, hence changing global atmospheric circulation.” We currently have near-to-below average sea surface temperatures in the Pacific, consistent with neutral-ENSO conditions. As we hit December, there’s a 62% probability of La Nina developing and a 59% probability of returning to ENSO neutral conditions by March 2025. However, the Nina is not predicted to be very strong – in fact we have a weak, short-duration likelihood of a La Nina winter. So, with minimal ENSO influence, other climate and weather factors could play a larger role.
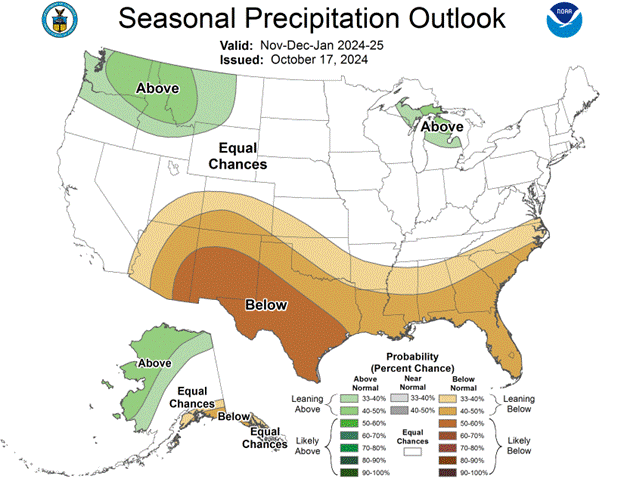
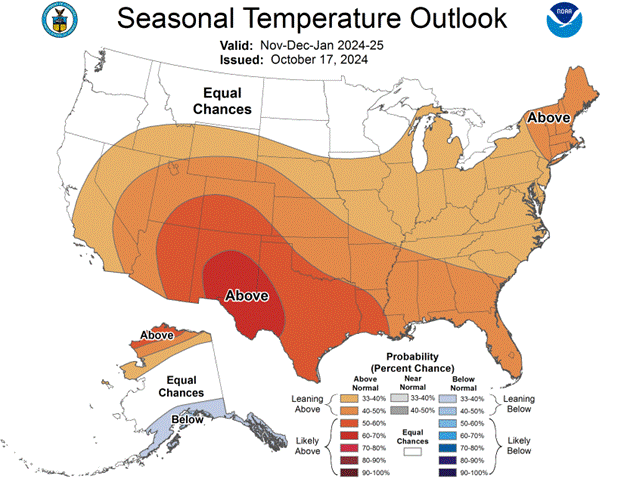
While unpopular, NOAA seasonal outlook for Oct-Dec suggest below-average precipitation for most of Colorado, and above average temperatures for entire region (60-70% or the Four Corners region). In fact, most of the winter is along those lines. November-January seasonal outlook favors above-normal seasonal mean temperatures and generally below-average precipitation, though parts of the northern Rockies might be slightly above.
In terms of other climate and weather phenomena, let’s keep an eye our for some atmospheric rivers from the eastern Pacific. Like the jet stream, ARs move southward throughout the winter. If we get a good stream of moisture that misses the Sierra’s and heads inland, it could be grand! There’s about a 30% chance of inland precipitation this season as a result of atmospheric rivers, so here’s hopin’.

