

Summary
The CSAS team conducted another statewide CODOS tour May 5-6. Fortunately we documented no new dust events over the last 4 weeks. So far this season we have documented a total of 4 dust events, tying WY2015 for the least number of dust events observed. However, it’s not so much the number of events that matter but the severity and timing of the events. It just takes one moderate/severe event, deposited toward the end of the accumulation season to drastically effect snowmelt timing and rate for the remainder of the snow season. So far this year, D3 (moderate) and D4 (upper end of moderate), occurred during this timeframe (March 31 and April 9), when maximum snow accumulation is largely reached in most watersheds, thereby allowing the dust to remain near or on the surface throughout ablation. And as we like to mention often, spring conditions play a large role in determining when and how long the dust is exposed. For example, since D3/D4 we have seen a number of stormy periods bringing additional snow accumulation, overcast and cooler temperatures, which temporarily cover the dust and slow snowpack warming and melt. April is typically the month where we see the most dust events, then March, then May. Even with April behind us, the dust-on-snow season is far from over. Any dust events that were to happen now would immediately be exposed, or within a couple days, on the surface of the snowpack, adding to the dust presently on snow surface, further reducing albedo and increasing snowmelt rates.
Breaking News: As of this writing a long duration dust event was observed in the Grand Junction area late afternoon on May 7th, the remnants of which have been noted in the Roaring Fork Valley. Station data in the source area show sustained wind gusts from May 6-7, and webcams indicate dust in the Monticello region. So, it looks possible dust event #5 has arrived in some locales (this morning observations at SBB reveal no new dust deposition), a day after the CODOS tour was completed (much like D4 on April 9). Expect more information as to the severity and spatial extent of this potential dust event once field data and observations are collected.
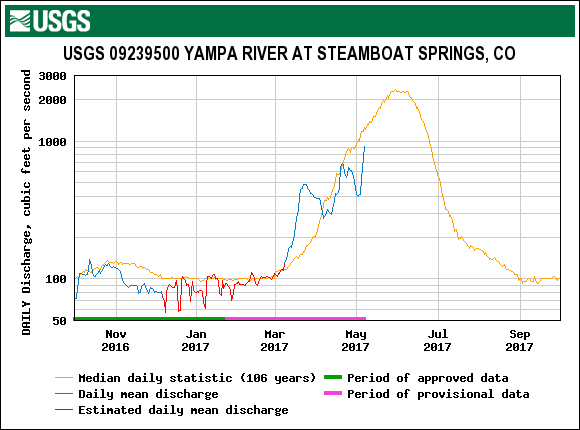
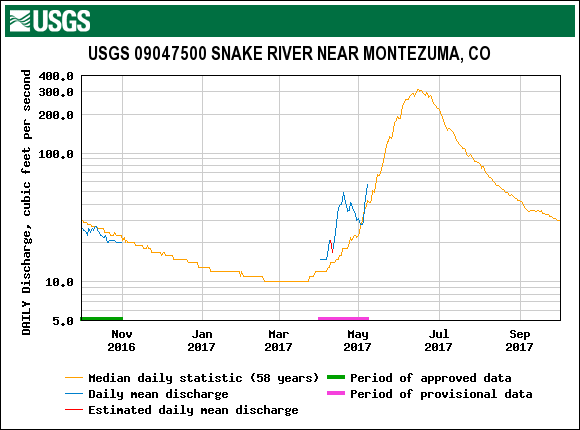
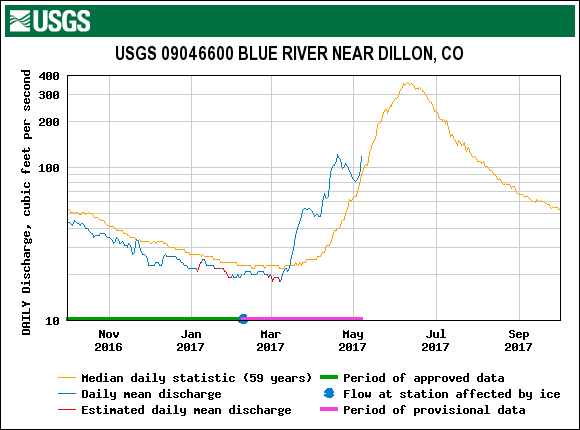
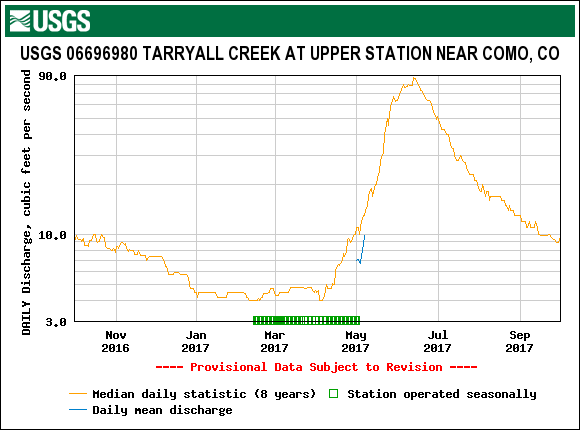
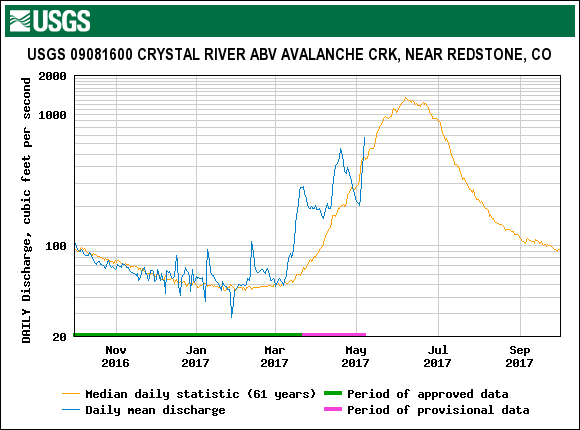
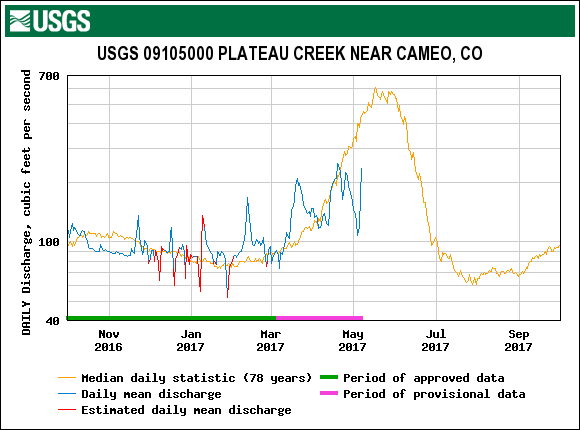
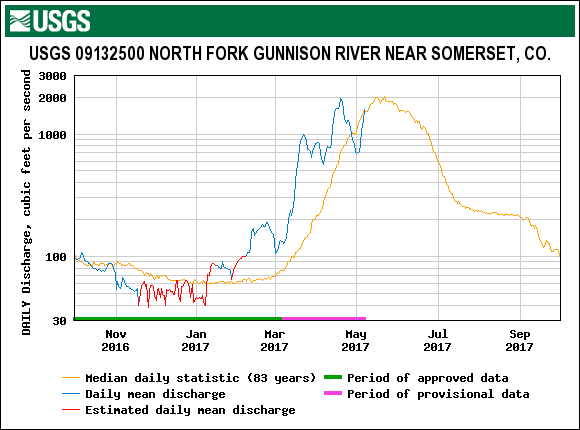
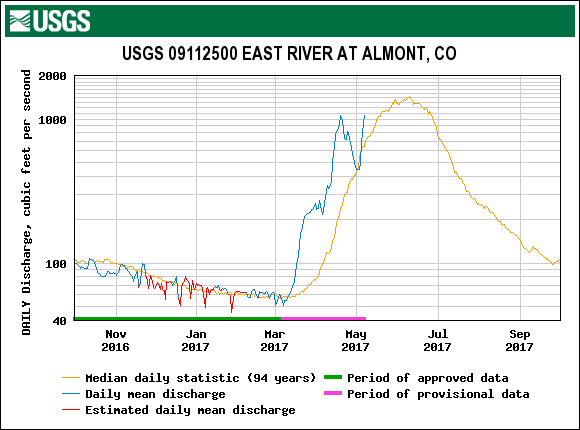
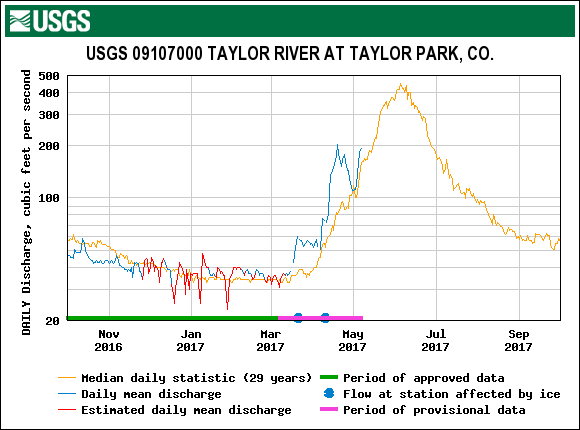
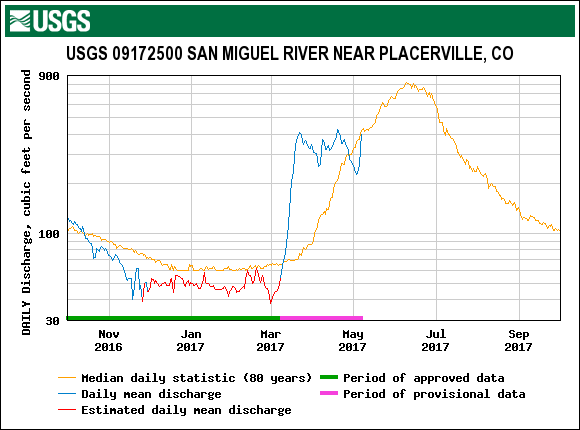
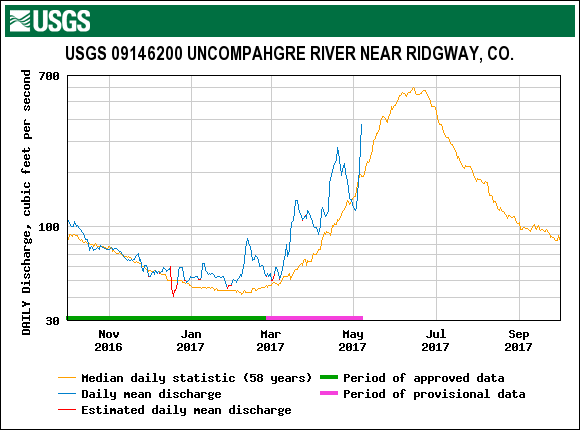
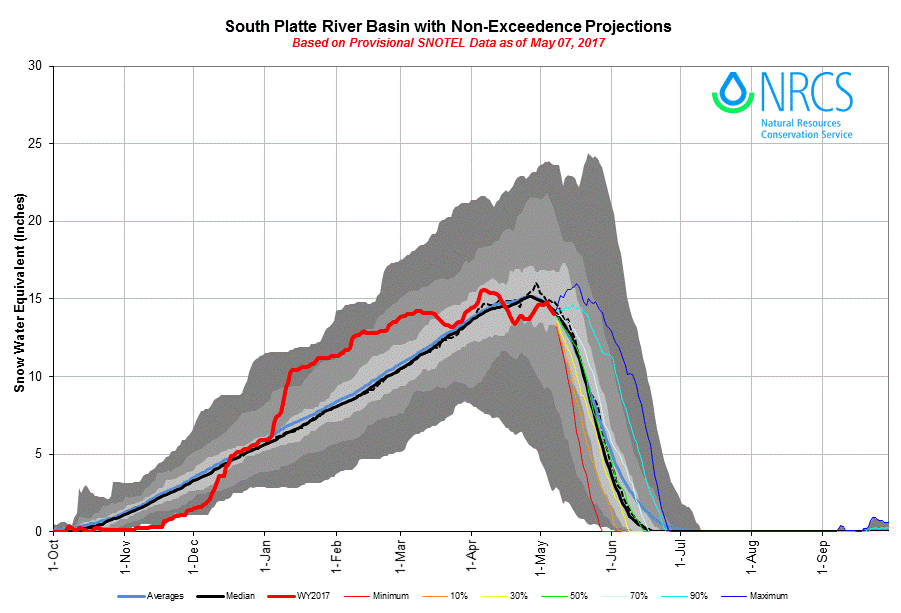
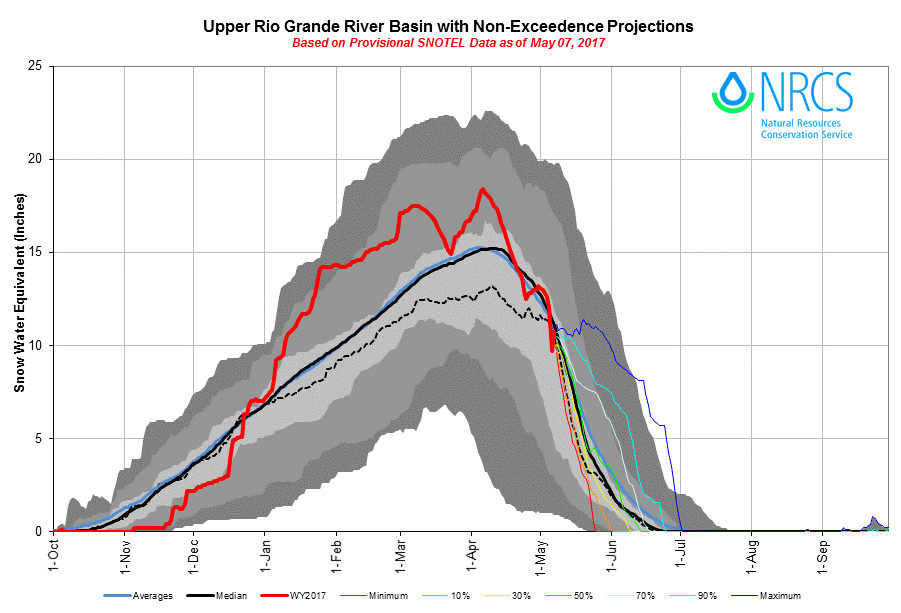
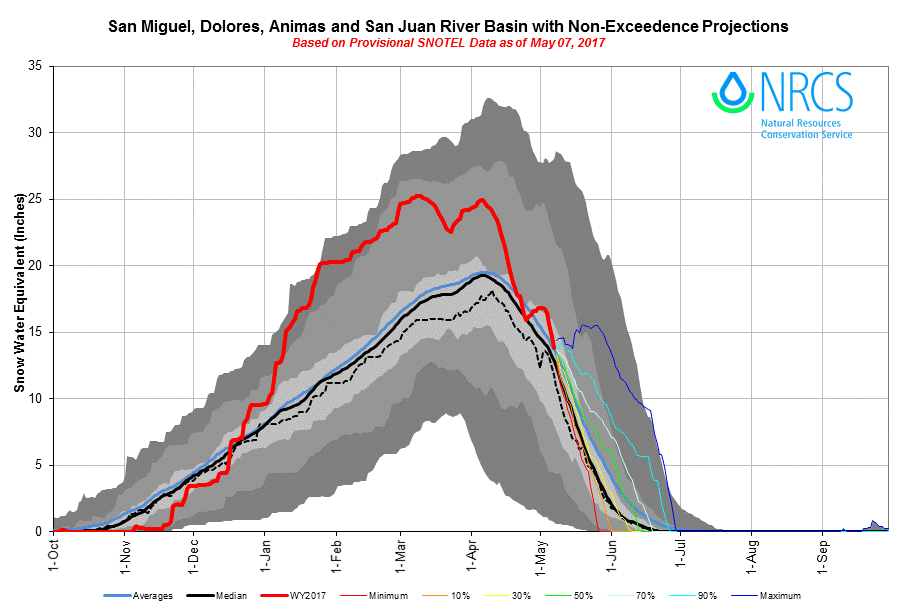
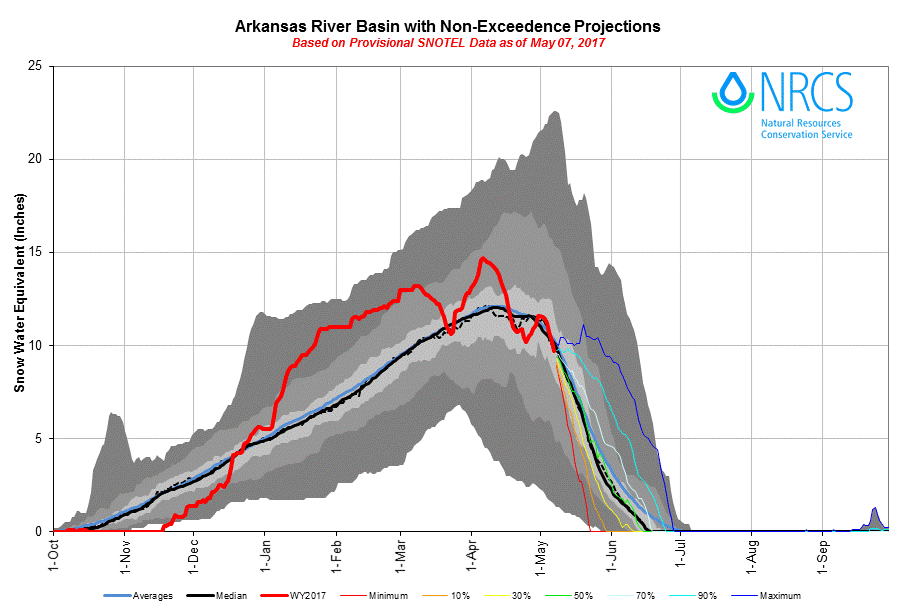
SNOTEL data indicate major Colorado basins are near their long term median SWE with streamflows, showing a spike from the hot weather these past 6 days, are still mostly considered within their median range. The forecast is calling for more variable weather with plenty of chances of precipitation with cooler temperatures. Please see streamflow and forecast discussion below.
COLORADO DUST-ON-SNOW CONDITIONS
Dust conditions around the state were mostly how we left it from our last CODOS tour April 7-9. Colorado has not received any new dust events over the last month, albeit we possibly experienced one or two “haze” events in some locales, which, if any minor deposition occurred at all, it would be indistinguishable from the dust already on the surface of the snowpack. To recap the four dust events this year; dust event #1 (D1) occurred on March 5, and D2 occurred on March 23, both of these events were very light and mostly unnoticeable for a few days after deposited until finally showing itself throughout the landscape. D3 came in on March 31 and classified as moderate at SASP. On April 9, the last day of our CODOS tour, a large part of Colorado received D4, which is considered to be in the upper end of moderate to lower end of severe category. D4 was a “dry” event being transported and deposited without precipitation. Dry events are characteristically deposited in preferential locations wherever the wind transports and releases the dust, such as depressions on the snow surface, leeward slopes, and treed depressions. Some locales came out of the last 10 days of April with dust layers covered under a few inches of new snow, other areas like the Rio Grande basin did not see much, or any accumulation, so dust was already exposed when the warming trend over the last few days started. Currently, at most CODOS sample sites, dust layers are now merged at the surface.
Changes in dust conditions, however, were observed at Berthoud and Willow Creek where, either through receiving indistinguishable amounts of just one dust event or all four, over time with snowmelt has allowed this light dust to coalesce at the surface, making it visible across the landscape. This dust does not change the “minimum” dust classification at these sites, but will play its usual role in reducing albedo and increasing the amount of solar energy absorbed into the snowpack. In the table below we summarize snowpack and dust conditions as well as provide plausible prior year hydrographs, updated from what was reported last month, that might help shed light on what to expect the remainder of this snowmelt season. Links to these hydrographs are available at the bottom of this report.
Table 1. Dust and snowpack conditions as of May 6, 2017, with current Dust Enhanced Runoff Classification (DERC) categorization. “Current DERC Spring Conditions” are characterizations of spring weather to date (March 1-May 9). If there are no previous water years in the DERC matrix to directly compare with WY2017, then these sites are noted in bold, and alternate water years are presented (or not at all for Berthoud) that may offer an idea of possible runoff scenarios that are close to current conditions.
STREAMFLOW


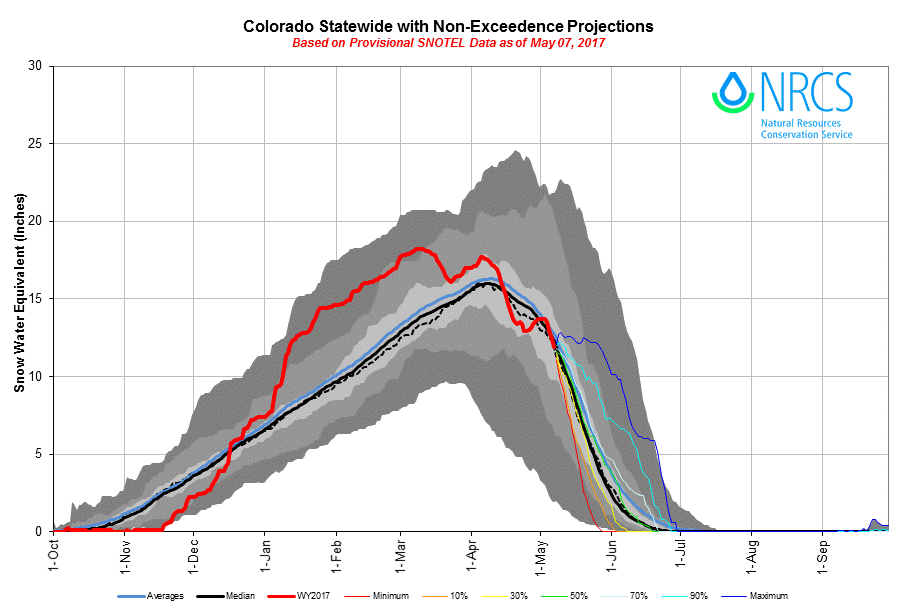
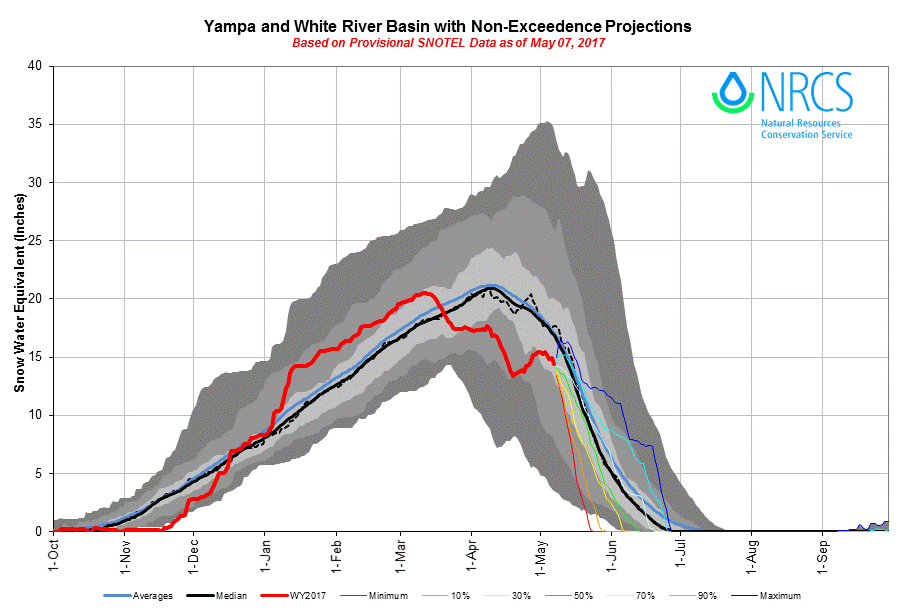
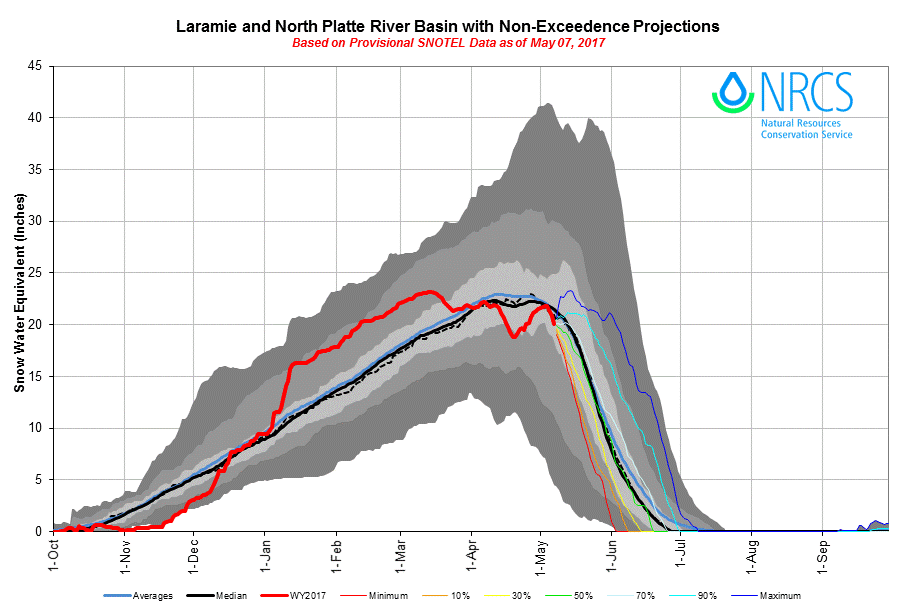
SWE CONDITIONS
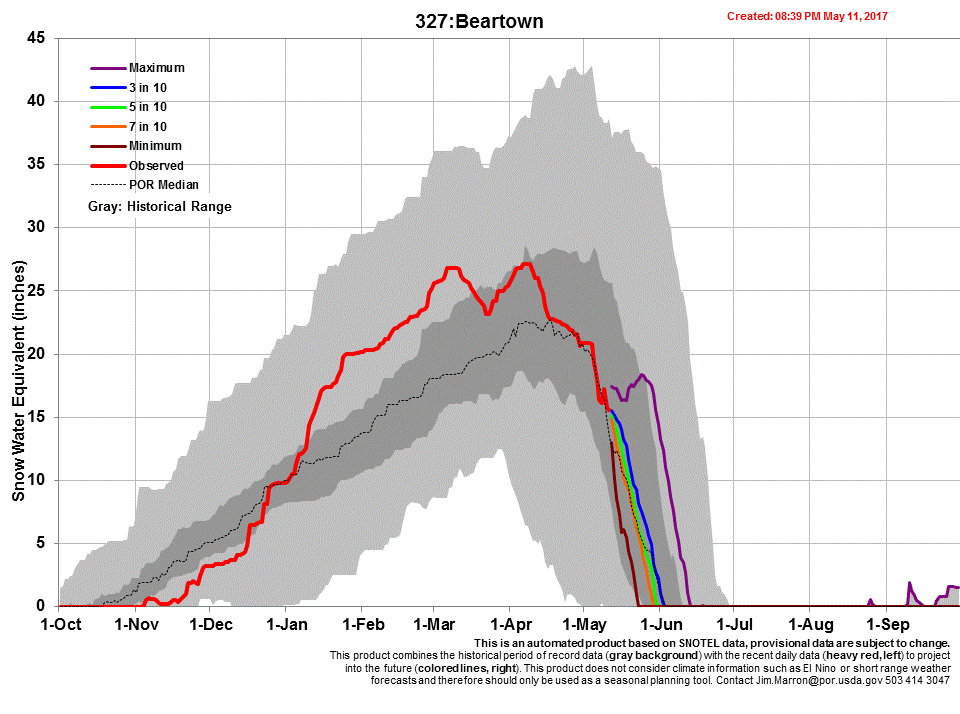

BASIN SWE CONDITIONS


PAIRED PROFILES


SNOWPACK/DUST SUMMARY
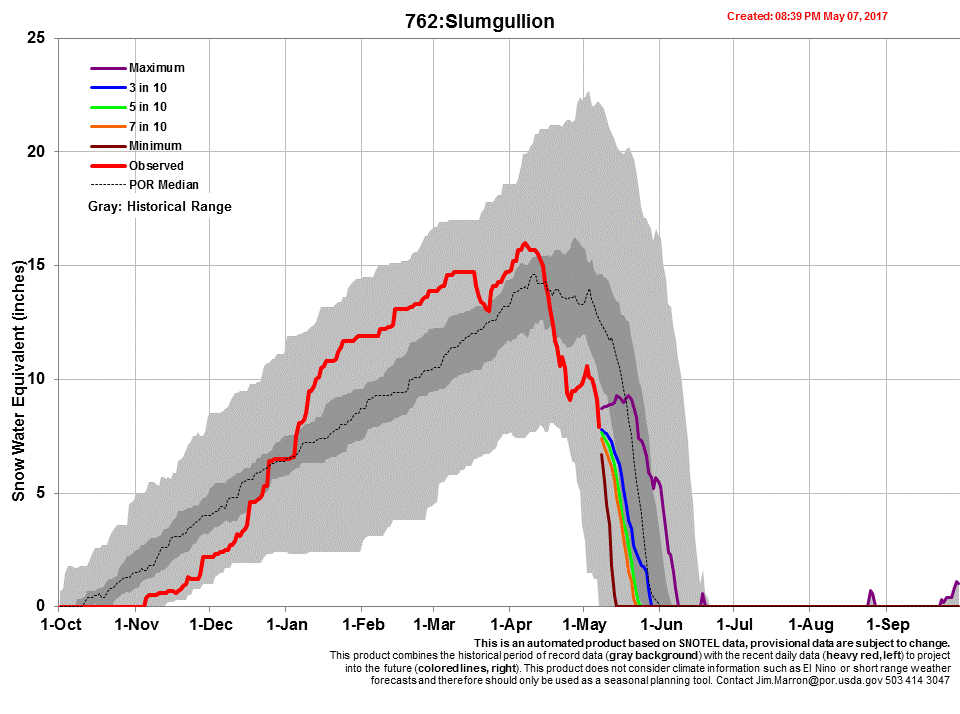
Senator Beck Study Basin: The last 10 days of April delivering inclement weather and addition snow accumulation at Swamp Angel Study Plot (11.060’) resulting in dust layers D3/D4 being buried 8” below snow surface, observed on May 3. And 10.6” below the surface at Senator Beck Study Plot (12,186’). As of May 7, after 4 days of sunny and warm temperatures, this dust layer is now once again exposed across the landscape. SASP SWE = 28.3”. SASP snowdepth = 5.6’ (1.70 m). SBSP SWE = 27.2”, snowdepth = 27.2” (1.83 m).
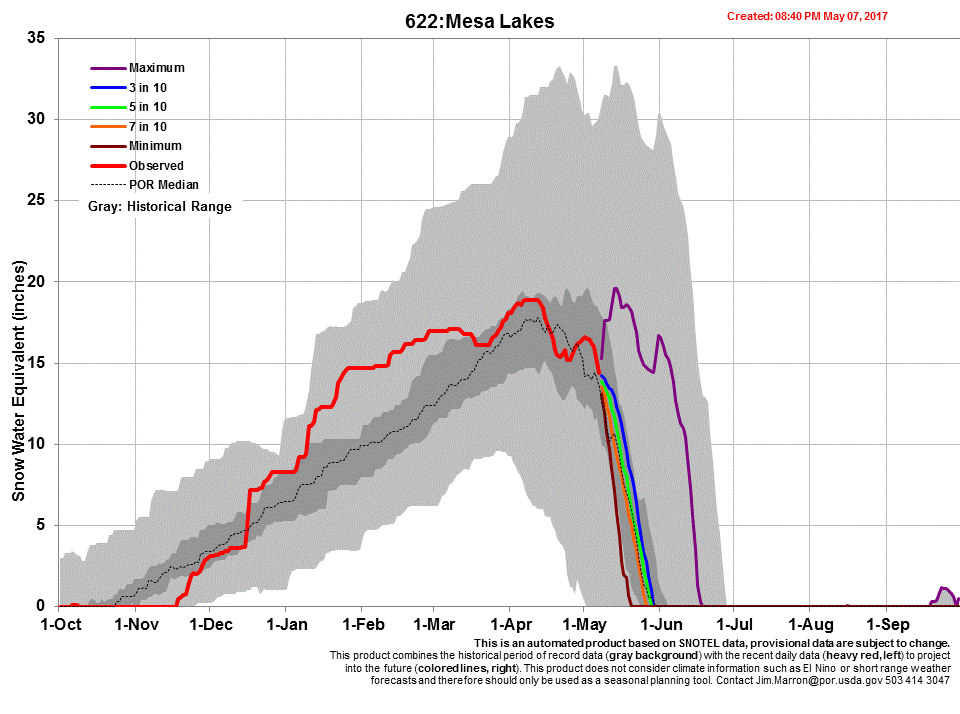
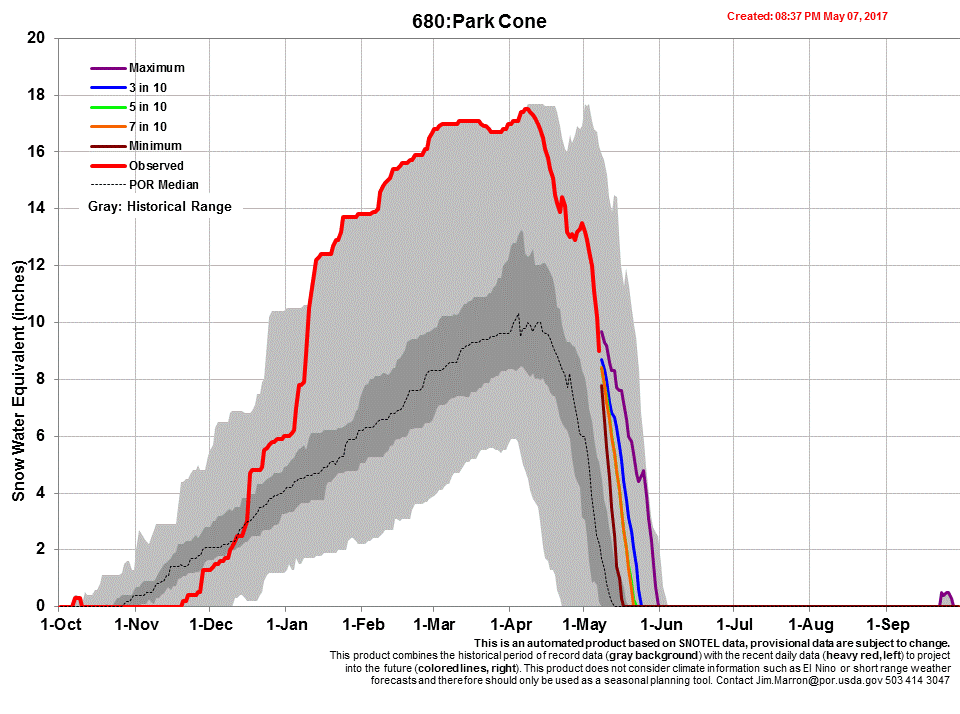
Park Cone: Moderate dust observed on surface of snow at sample site and surrounding landscape. SWE = 7.9”. Snowdepth = 15.7” (0.40 m). Due to dimensioning snow cover, collected all-layers-merged samples for USGS analysis.
Spring Creek Pass: Dust observed on surface and surrounding landscape. SWE = 7.6”. Snowdepth = 1.5’ (0.47 m). Due to dimensioning snow cover, collected all-layers-merged samples for USGS analysis.
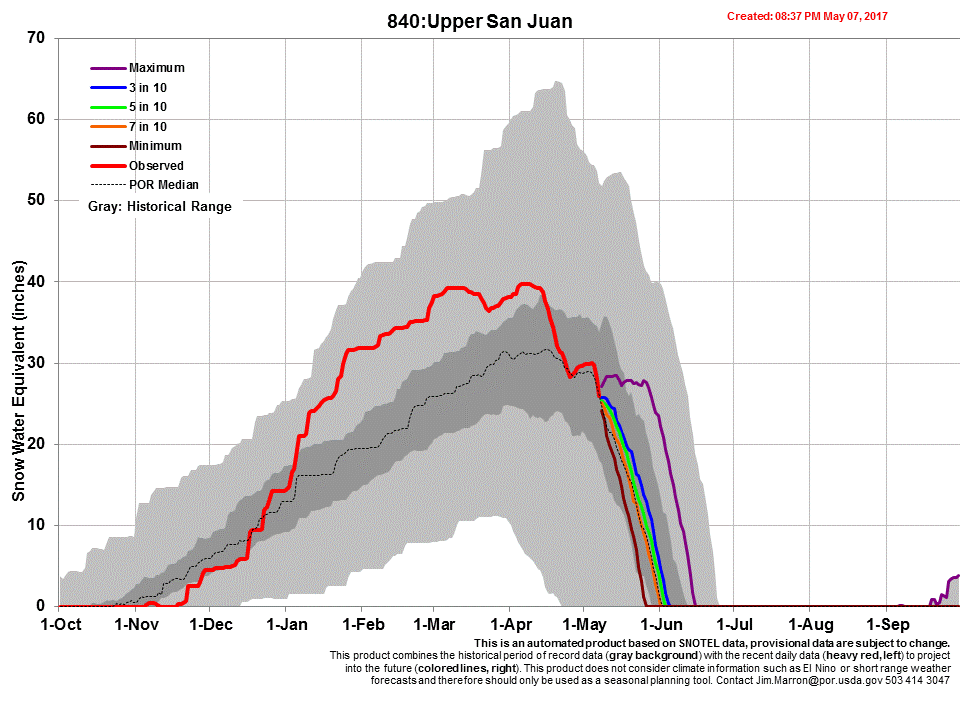
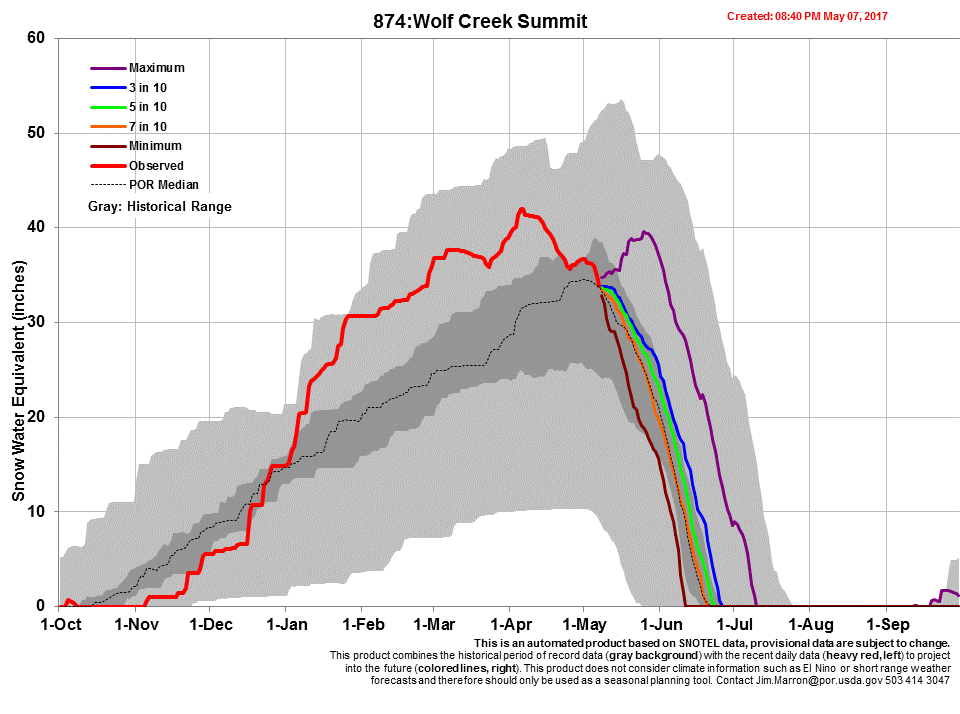
Wolf Creek Pass: Dust observed on surface, and dust was likely on surface immediately following the stormy period the last 10 days of April. Wet snowpack. SWE = 26.8”. Snowdepth = 4.2’ (1.29 m).
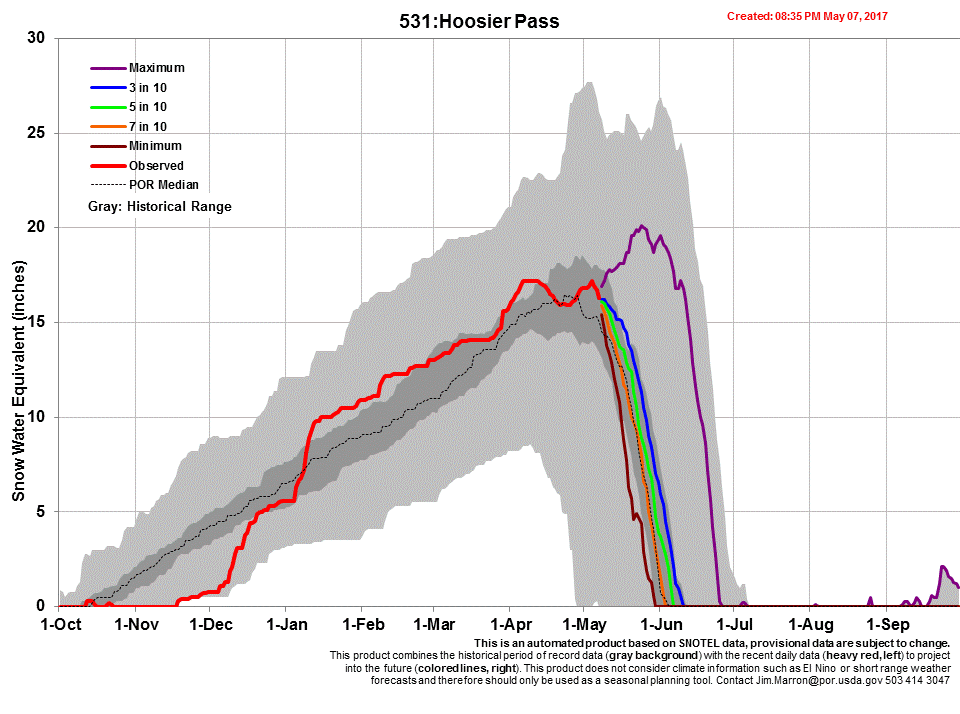
Hoosier Pass: Dust observed in preferential locations across landscape. SWE = 20.6”, Snowdepth = 3.9’ (1.19 m).
Loveland Pass: Dust observed on surface and within top 1 cm of snowpack. SWE = 22.6”, Snowdepth = 4.3’ (1.30 m).
Berthoud Pass: Dust Observed on and near surface, most evident in wet loose avalanche bed surfaces. SWE = 19.9". Snowdepth = 4.1' (1.24 m).
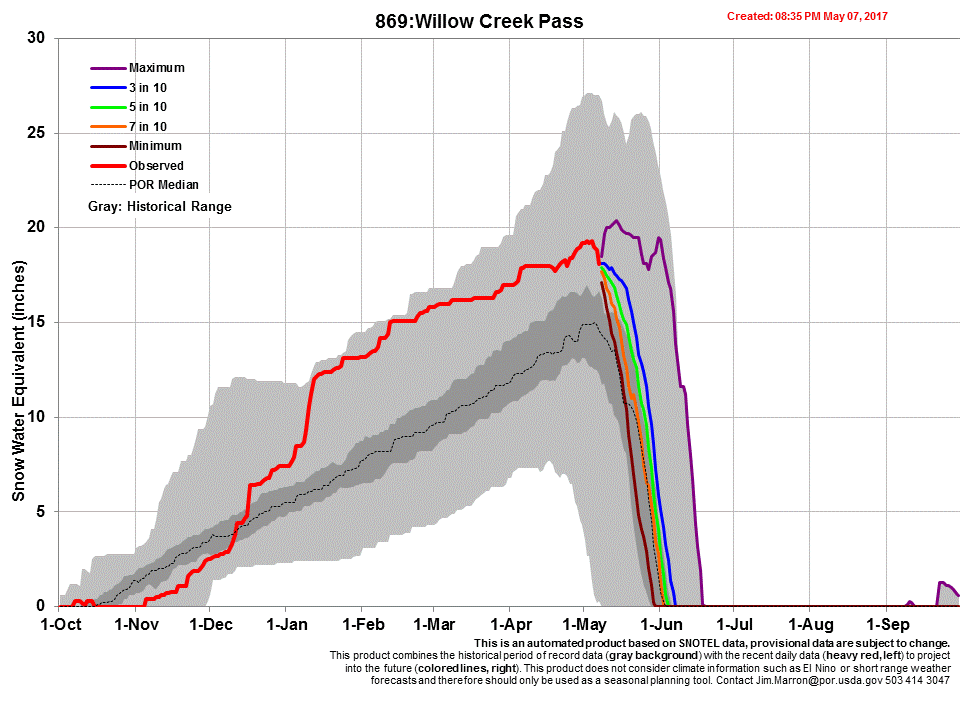
Willow Creek Pass: Snow nearly gone, with dust very visible on the surface. SWE = 7.2”. Snowdepth = 1.3’ (0.39 m). Due to dimensioning snow cover, collected all-layers-merged samples for USGS analysis.
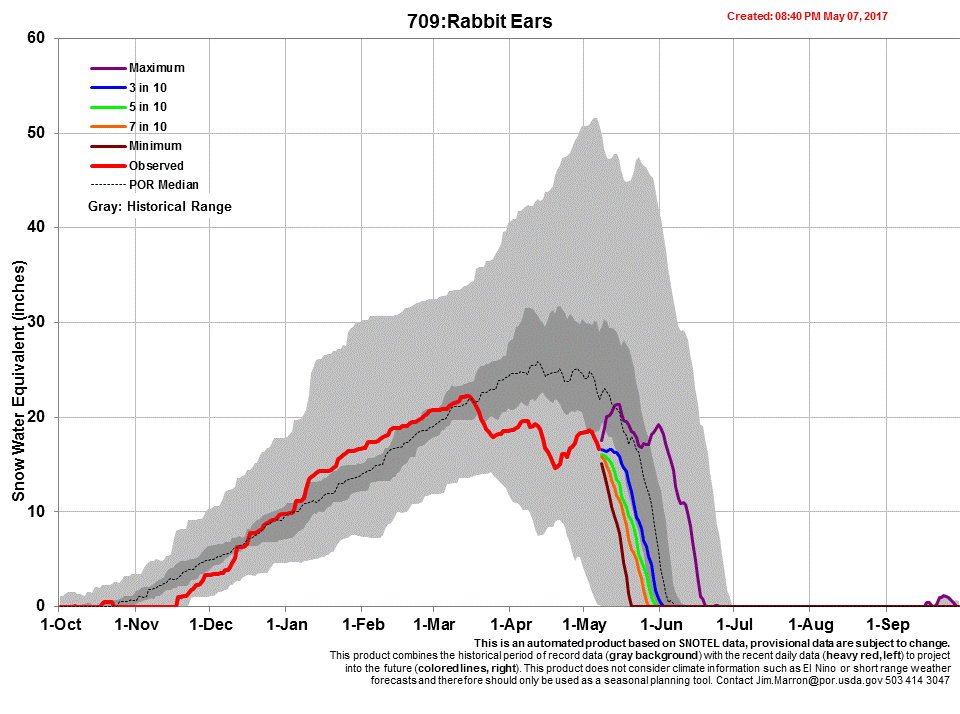
Rabbit Ears Pass: Dust visible in pit, but largely buried across landscape. SWE = 26.7”. Snowdepth = 4.7’ (1.43 m).
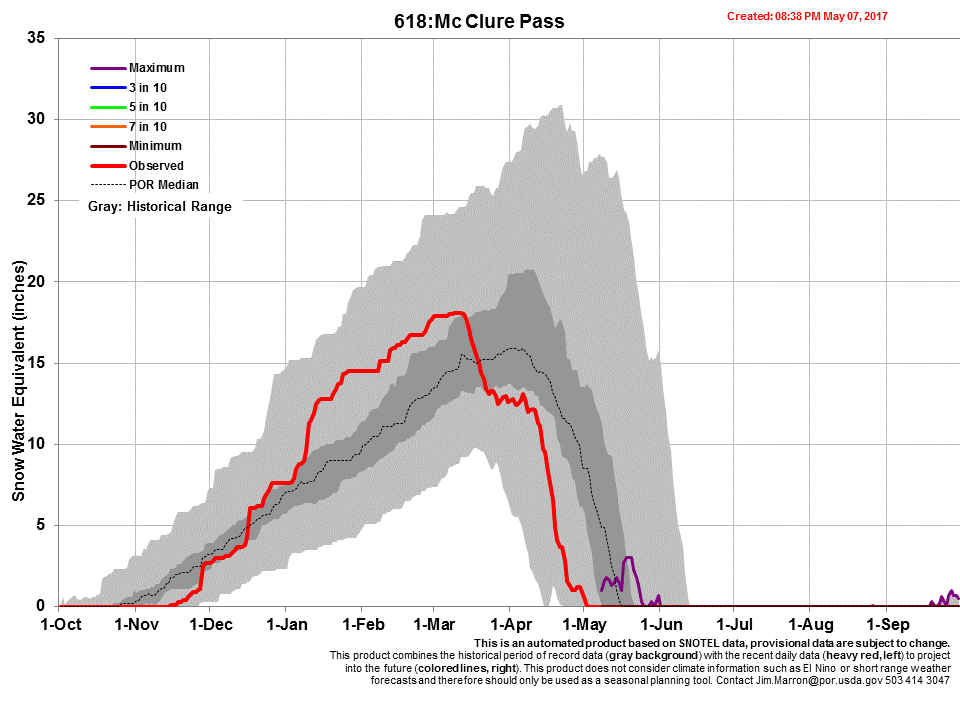
McClure Pass: Snow all gone at site. Region is dry below pass with snow remaining only at the highest elevations. SWE = 0.0”. Snowdepth = 0.0’ (0.0 m). Collected all-layers-merged samples for USGS analysis.
Grand Mesa: Significant dust observed in snow profile and throughout the landscape. Dust is at or near the surface. D1 and D2 no longer visible in pit, due to either leeching (more likely) or merging with D3 and D4 (less likely). SWE = 23.9”. Snowdepth = 4.2’ (1.29 m).
SWE plot at Swamp Angel Study Plot (11,060’).
SWE plot at Senator Beck Study Plot (12,186’).
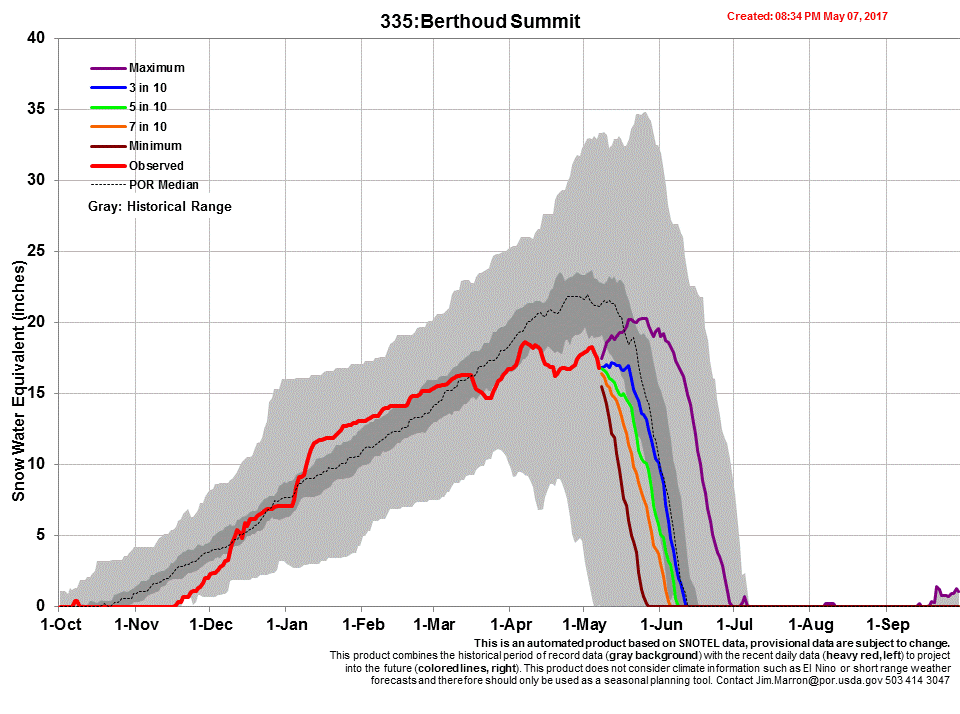
Berthoud Summit snow profile from May 5.
Berthoud Summit snow pit site. Some dust was observed on the landscape. Dust was located a few cm below the snow surface and was visible in the bed surfaces of numerous wet loose avalanches.
The very shallow Willow Creek snow profile on May 5.
Snow is nearly gone at Willow Creek. Dust is very visible on the snow surface at the site.
The Rabbit Ears snow profile from May 6, 2017. The merged dust layers are visible 25cm below the surface.
Grand Mesa snow profile on May 6. Merged dust layers are visible just under the surface, somewhat diffuse over a 5-8 cm area.
Dust is very visible on or near the surface at Grand Mesa
More Grand Mesa dust. Dust from dry event D4 is blown into lee areas.
Snow all gone at McClure Pass. The SNOTEL is in the foreground, and the CODOS site is on the low angle hill behind.
McClure Pass, all layers merged sample was collected from isolated nearby snow patches.
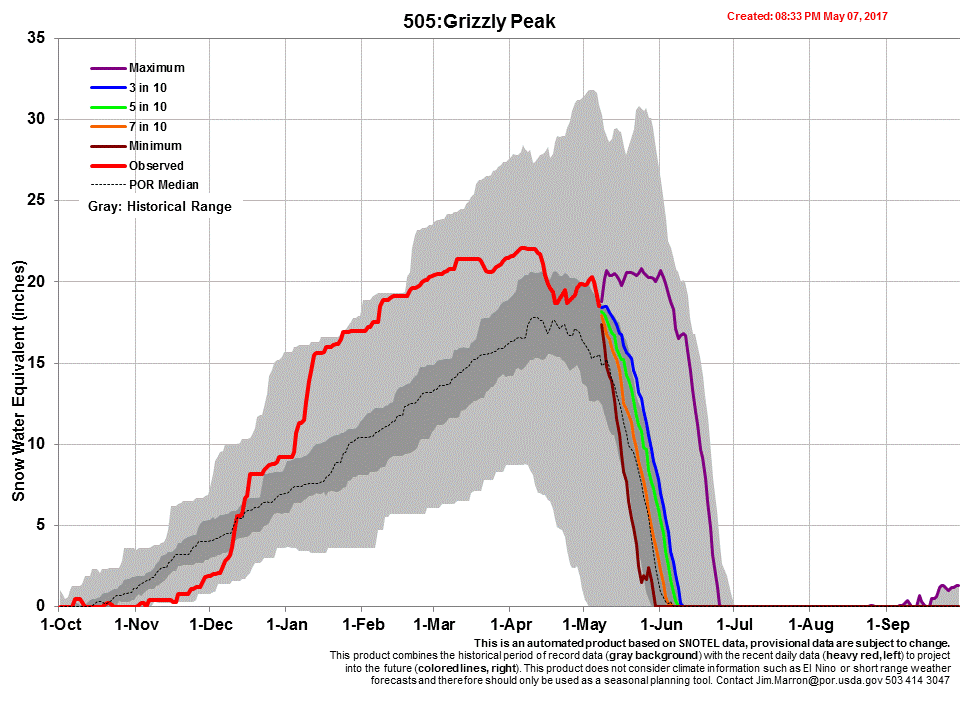
Grizzly Peak snow profile, located near Grizzly Peak SNOTEL. Merged dust layers are just slightly beneath surface.
View from Loveland Pass, looking down towards Grizzly Peak SNOTEL and sample site.
Snow profile at Park Cone on May 5. CODOS site is in an open, north-sloping meadow, uphill of the Park Cone snow course and adjacent to the Park Cone SNOTEL.
Landscape near Park Cone sample site.
Spring Creek CODOS site on May 5. D1-D4 located on surface of snow.
View from Spring Creek towards the Rio Grande valley.
View from Spring Creek CODOS sample site, D1-D4 on surface. Overland flow and streamflow seen at bottom of hill.
Wolf Creek Summit CODOS snow profile on May 5.
Near Wolf Creek Summit, with emerged dust as of May 5.
Looking up towards Rio Grande reservoir.
The Hoosier Pass snow profile on May 6, 2017. In this photo, light dust events D1-3 are located 2” below surface.
Near Hoosier Pass sample site. Dust on landscape.
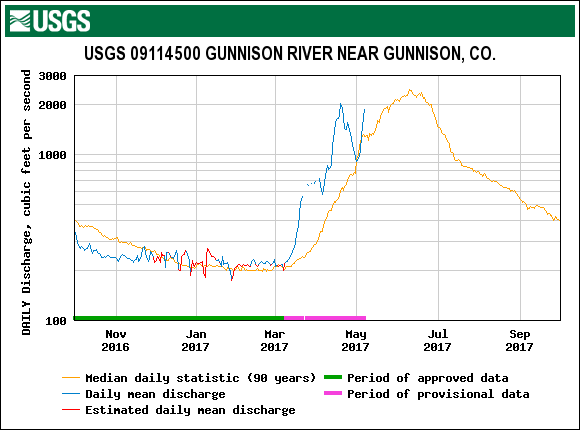
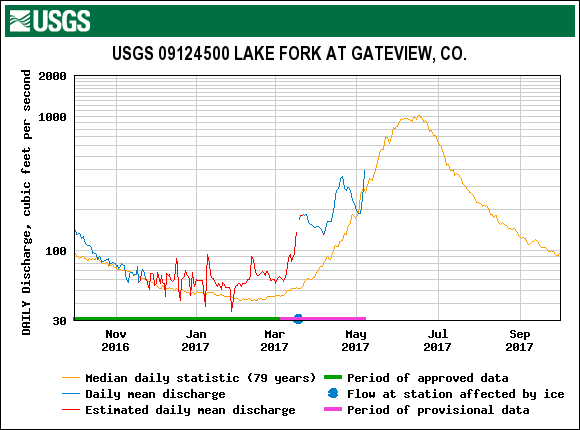
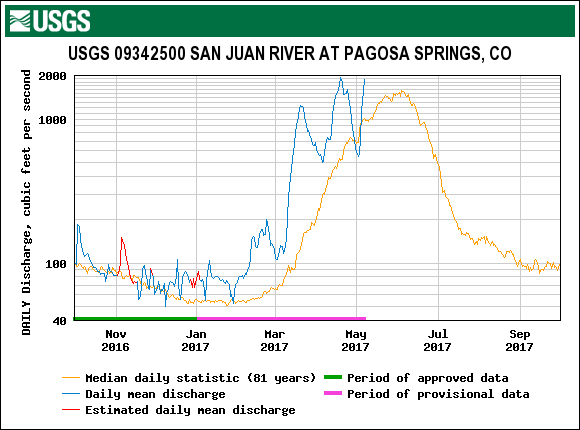
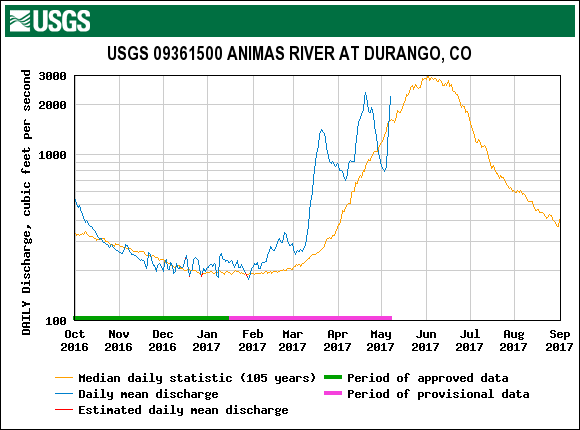
STREAMFLOW
Despite recent warm temperatures nearly all rivers are running within a normal median range statewide. With the return of unstable weather in the coming days, we mostly expect to see this trend within the median range to continue for the most part, but declines in discharge are likely as hydrographs will start varying somewhat depending on duration of overcast, cooler temperatures and what snow may accumulate and at what elevation. A possible exception would be in the event of significant rain associated with upcoming storms, especially rain on snow, but it is unlikely that significant rain will fall at higher, snowier elevations. See the below weather and climatology outlook for more info.
At Swamp Angel, this recent warming trend started out with significant dust being covered by ~8” of clean snow accumulation, combined with the upper ~1.5’ of the snowpack having experienced a slight cool down from the stretch of cooler weather, there was a bit of lag time before a spike in streamflow was observed over the past few days here in Senator Beck Basin (interesting to closely consider discharge rates in the Rio Grande, for example, that started out the warming trend with no new accumulation and dust already at the surface). Also too, other factors may have been in play at SBB, including loss of snowmelt to underlying soils or a temporary "unripe" snowpack which retained liquid water instead of releasing into the waterways. Snowpack is very near the long-term median at Red Mountain SNOTEL and slightly above normal at Swamp Angel (currently ~28” SWE compared to period of record average SWE of ~25”), so the snow at some locations may have had a higher capacity for liquid water. With most major basins at 92%-107% of median snowpack (Yampa 84%) there is still a good amount of snow left to melt. Also, as of May 4, when we assessed the snowpack at Senator Beck Study Plot (12,186’) there was still some cold content in the upper 3’ (1 m) of the snowpack (average snowpack temperature of -0.65° C), so for the time being at SBB the higher elevations have yet to significantly contribute to stream discharge.
Statewide, many rivers saw a sharp increase in flow over the past few days (particularly the Rio Grande basin), while largely still maintaining normal ranges for streamflow. The below figure from the Colorado Basin River Forecast Center states this clearly. Blue dots indicate gauges reading within the normal median ranges for this date, and one can see that the state is largely experiencing average runoff. As stated above, it will be possible to see declines in runoff compared to the median with the return of overcast and cooler temperatures.
WEATHER & CLIMATOLOGY
Our most recent warm spell is at it's end, and unsettled weather is forecasted to move back into the four corners region. A slow moving closed low pressure system is spinning up from the Gulf of California and will affect the region for the next several days. During this period we expect to see moderate precipitation, falling temperatures and increased winds. Being May, it is possible for us to see some rain on our snowpack, but we will have to wait to determine the effects, if notable, of potential warmer precipitation.
After a brief clearing at the end of the week, there is excellent agreement across most weather models suggesting a major low pressure system moving in from the Northwest, and unstable weather is expected to result as this moves into the region. To sum it up, the next week and beyond are expected to be characterized by moderately stormy weather with on and off precipitation.
After the past few days of very warm temperatures across the region, it is possible that our upwind dust source areas experienced enough drying to result in surface dust available for long range transport. As this unstable weather approaches we will be closely watching both our snowpack and weather as well as winds and surface conditions in our desert dust source regions to determine the likelihood of additional dust deposition here In the San Juans and statewide.
Long range forecasts from the Climate Prediction Center, a branch of the National Weather Service, indicate that May temperatures and precipitation will both be above average. While these long range forecasts are always questionable, our best guess right now is to expect a warm wet month coming up. This is an interesting forecast, on both a regional and national scale, so we will be watching closely to verify or reject this outlook. See the figures below for a look at the May forecast.