SUMMARY
As a big relief to the state of Colorado and Southwestern US in general, water year 2019 (WY2019) was the exact opposite of WY2018. It is hard to recall (maybe WY2011/WY2012) such opposite back-back extreme years. WY2019 started off solid in terms of amount and severity of winter storms and kept getting better as the season went on. After a hot and dry summer October brought tropical moisture from hurricane Rosa and Sergio which meant a little relief with average/above average precipitation and even cooler than normal temperatures for most of Colorado. Precipitation started sticking around as snow the latter part of October and thus winter was underway. November and December brought the near normal number of storms but by the end of December the Rio Grande and Southwest Basins were almost at half of normal SWE while the rest of Colorado was right at normal. But the month of January was very good to Southern Colorado, and Central and Northern, with 5 productive storms. With the first storm of February Southern Colorado was back to median SWE, and it didn’t stop there. During February/March a persistent trough over the western U.S. directed a series of storm systems across Colorado The month of February was equally good to Southern Colorado with another 5 storms stacked on top of each other, so that, by months end Southern Colorado was enjoying being a few inches above median SWE for the first time since WY2017. Between February and latter March we received at least 4 atmospheric rivers and the remnants of at least a few others. Central and Northern Colorado were seeing steady gains in snowpack as well. Many SNOTELS reported record breaking precipitation totals during this time. After a solid two months of accumulation, where Colorado as a whole gained 7” SWE but in areas like SW Colorado and Rio Grande it was 14”and 10”, respectively. March hits the Colorado Mountains equally hard. Four winter storms occurred in March but they were significant. Storm #18, March 2-4, lasted 50 hours and brought 2.2” precipitation. Storm #19, March 6-9, lasted 77 hours and brought another 2.2”. Storm #20, March 11-14, lasted 71 hours and brought 3.1”. The first fourteen days of March eleven of those days was a storm that in total equaled 7.5” SWE. Rapidly putting all of this snow - much of which was wind redistributed - on top of an already loaded snowpack, which itself was sitting on classic Colorado basal facets, was the last straw. Colorado experienced an avalanche cycle that we have not seen in our lifetimes. There were slides occurring that were 300 year events and one in particular hit the highest (D5) avalanche destructive rating. The cycle was across all of the Colorado Mountains. Highway 550 at Red Mountain Pass was closed for over three weeks preventing access to SBB. Following that crazy month April seemed rather boring with three winter storms. There were dry spots in Eastern and Southwestern Colorado and wet spots in some mountain regions but largely near normal for the mountains. A deep and persistent trough settled over the West during the last two weeks of May bringing back very wet conditions with four long duration storms, which prevented rapid snowmelt and added near double the usual water content to the snowpack. Many SNOTEL sites saw peak SWE after the initial storms the first part of May. The large snowpack and wet/cool spring meant most rivers peaked in June and even in July. Winter storm reports can be viewed at the snowstudies.org website.
At the Center for Snow and Avalanche Studies’ (CSAS) Senator Beck Basin Study Area (SBB) located at Red Mountain Pass, the primary Colorado Dust-on-Snow Program (CODOS) monitoring site, WY2019 produced a total of seven separate dust-on-snow events, about average in terms of number of events, and also in terms of total dust loading based on observations going back to WY2005. Dust events began around the normal time-frame (February) likely since the dust source region saw adequate precipitation and no storm events associated with high surface winds tracking through the region during October-January. But it was only a matter of time before eventual spring season storms would track through the source region resulting in dust-on-snow (DOS) to the Colorado snowpack.
Dust-on-snow events occurred February 3, March 6, April 9, May 1, May 16, May 19, and May 23. The first event (D1) was very light, it was not observable in snow profiles at Swamp Angel Study Plot (SASP) but was at certain collection points across the landscape at SBB and at Lizard Head Pass. D2, occurring on March 6, was about 5’ up in a 7’ snowpack near the time of peak SWE. D2 was a pretty heavy wet event (deposited with precipitation) being a very apparent layer in the snowpack. A very windy episode throughout the Southwest resulted in the dry D3 event on April 9. It was moderate severity and was immediately buried by subsequent snowfall. D4 came in with the May 1 storm and was not too obvious at lower elevations but much more distinct above treeline. D3 and D4 merged together pretty soon thereafter at SASP but with a larger separation at Senator Beck Study Plot (SBSP). Dry event D5 was the most severe event this season falling on merged D3/D4. This was all covered again with ~15” new snow accumulation. This is good but also with this snow came D6 on May 19, intermixed with the new accumulation. On May 23 the last DOS event was documented, at this time the top 1.6’ of the snowpack contained all the dust layers of the season. This top 1.6’ accounted for 7” of SWE, under the dust sat the remaining 28.5” of SWE. Once conditions were to allow it, dust layers would merge and be fully emerged on the surface accelerating snowmelt of this 28.5” of water. This was eventually the case, but being such a stormy spring season the snowpack had been added to substantially and high snowmelt rates had been held in check.
We classified dust severity as “Average” in SBB. Still, all layers made for a very dirty dust-on-snow season but in-line with what has become the norm. Likewise, Northern and Central CODOS sample sites in Colorado were classified as “Average” dust severity in terms of what the regions normally see.
This Season Summary will often reference or link to snowpack, streamflow, weather, and climate products generated by the NRCS SNOTEL program, USGS National Water Information System, and NOAA National Weather Service and Climate Prediction Center, as presented and archived on CODOS monitoring site webpages.
MONTHLY WEATHER CONDITIONS
October Weather Summary
After Colorado’s warmest and 3rd driest (driest for northwestern and southwestern Colorado) water year on record, it was a relief to begin a new water year accompanied by cooler than normal air temperatures and a nice dose of precipitation in far western, eastern Colorado, and some mountain areas. In October we received tropical moisture from hurricane Rosa and Sergio and in addition a productive system out of the north. In our Senator Beck Study Basin we received 5.2” precipitation and at SBSP our higher monitoring site (12,200’) we saw 15” of snow accumulation. The precipitation slowly started showing itself in our stream gauge. Hard to imagine streams being in a much worse state, a few weeks earlier in August all stream channels in SBB were dry (and the Animas River at its lowest flows in 107 year record), with only a trickle of water coming to the surface a few hundred feet upstream of our gauge near the outlet of the watershed. After such a devastating WY2018 we had a long way to go in making up such a large precipitation deficit. At least the long-term forecast going into WY2019 was calling for a pattern shift from what we experienced last year, would it play out?
November Weather Summary
The first 5-days of November started out nicely with 26 mm (1.0”) precipitation, which constituted Storm #1 at SBB. However the 18 days that followed we observed only 9 mm (0.35”) precipitation. Thankfully, complex multiple frontal systems came through the Western U.S. resulting in 2 significant storms systems occurring Thanksgiving Day and then two days later on November 24. The precipitation from these two events totaled 21 mm (0.83”) at SBB (CSAS Storm #2). Overall boosting Mountain snowpack 8-10%, although the Upper Rio Grande mostly missed out on this round of precipitation, only gaining 1%. But the month wasn’t over, the last day of November and into the first few days of December a low pressure trough dipped south enough on southwest flow to give the San Juans a good shot of precipitation, 34 mm (1.3”) over a 4 day period to make it Storm #3 in SBB.
December Weather Summary
In December the forecast called for a weak trough to move across the area December 12 bringing scattered snow in the mountains. A more optimistic trough moved in immediately after in the Northern Rockies and dipped south with a strong jet moving over southern UT and the Four Corners region. This all translated into 3.4” of precipitation in the month of December. By Christmas, looking at the regional snowpack plots I was wondering if we were going to see a repeat of WY2018. Even with below normal precipitation across Colorado as a whole, Central and Northern Colorado Mountains were at or above median but Southwestern Colorado was worrisomely well below median for that time of year. But it was nice to see active weather so far the winter season. Compared to WY2018 at this time we were stuck under the wrong end of a high amplitude blocking pattern (the Ridiculously Resilient Ridge) that shut down storm activity, and routed storms to the north of Colorado.
January Weather Summary
In January the San Juan Mountains finally started to see significant building of the winter snowpack with 4.5” of precipitation for the month from 5 winter storms. Most of the Colorado Mountains were well above normal precipitation for the month. Upwards of 200% of normal for some areas. A powerful storm just exited the area on the first of the month, but not before it wrapped up storm total snowfall accumulations of 10 to 22 inches in the Southwest San Juan Mountains, 5 – 10” in the Animas River Basin, and 14 to 14.5 inches in the San Juan River Basin. Cold and clear nights set up over the region in the wake of this system with strong inversions developing in the snow-covered valleys. According to the NWS the coldest temperatures of the month occurred for 9 out of the 10 automated climate stations the morning of January 2nd with minimum temperatures ranging from -4 - -28 degrees F. Another round of winter weather occurred the second week of the month with generally 6 – 12” of snow falling in several mountain areas. An area of high pressure built over the Great Basin January 8th-10th before yet another winter disturbance moved into the region. This unsettled weather pattern continued pretty much through the end of the month with several storms passing through, producing some healthy snowfall accumulations for the mountains. As a result, the snowpack for Southern Colorado was able to climb to almost 90% of normal while the remainder of the basins ended the month around or slightly above normal.
February Weather Summary
February kept the ball rolling with above (200%-400%) normal precipitation, particularly the Western and Southwestern corner of the state. This is the month that set-up the stage of the snowpack for the even bigger dumping of snow that we would see in March. After a 9 day period of high pressure from Jan 25-Feb 2, winter weather returned with storm #13 and our first dust event of the season. This was a warm event with rain at lower elevations. Storm #14 immediately followed which brought 1.4” precipitation. Total for the first part week of February we received 2” precipitation. Mid-February brought another 2” of water from storm #15. Then the storms kept coming with one notable atmospheric river event. All total we received 6.6” water at SBB from 5 storms.
March Weather Summary
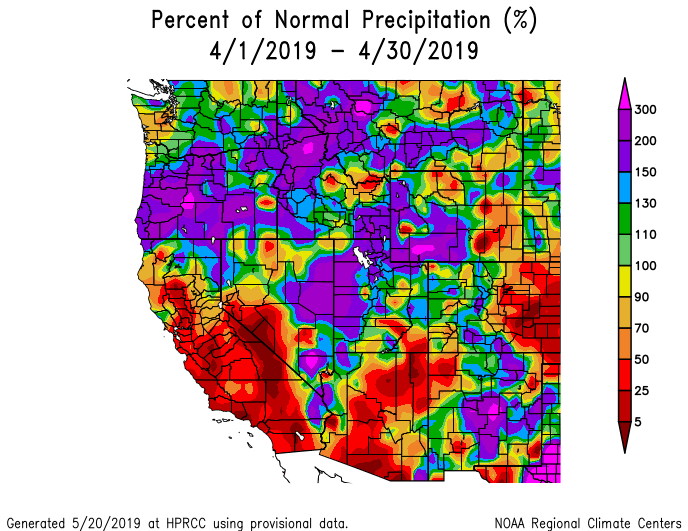
March is the month that made the record books. The 9.4” of water from 4 storms, and a lot of inclement weather, that fell pretty much just the first 23 days of the month made the SNOTEL data plots head sharply northwards. All of the Colorado Mountains received 150%-300% of normal precipitation (see precipitation maps below). The early March storms brought wind gusts upwards of 80 mph and our second dust-on-snow event of the season (D2). The March 13 storm was associated with a bomb cyclone, a rapid drop in pressure, that brought an equivalent to that a category 2 hurricane at its central pressure. The March 20 storm brought two feet of snow in portions of the San Juan Mountains and gusts of up to 60 mph.
But it is the rapid loading of an already loaded snowpack (sitting on a weak early season basal layer) that resulted in an epic avalanche cycle that also made March so historic. This set up the high country for historic avalanches, 300-year event avalanches, see this nice article from the Aspen Times about the Conundrum slide, Art Mears, avalanche consultant commented that this was “the largest Colorado avalanche I know of in my 46 years consulting”. Colorado Avalanche Information Center (CAIC) reported over 600 slides just in the first half of March, that being likely only 25% of the total over that period. Please see a small subset of photos below of avalanches in March. CAIC has an archive of documented slides that are necessary reading for any winter backcountry enthusiast. Driving in the Colorado Mountains in summer one sees a transformed landscape and all the fallen, broken trees attest to the power and reach of an avalanche.
April Weather Summary
April was a bit of a drying out period. Eastern Colorado really struggled with dry conditions. In the Colorado Mountains it was closer to normal overall with 3 storms giving us 4.6” of water total. An April 9-12 storm brought 73 mph wind gusts and DOS event #3. A nice storm the end of the month lasted 60 hours and brought 2.3” of water. April was the first month were temperatures were warmer across the entire Western US as well as Colorado . Up until this point it was variable across the state with mountain regions being largely cooler than normal with a few exceptions in location and time. SNOTEL stations reported peak SWE a bit later than average overall.
May:
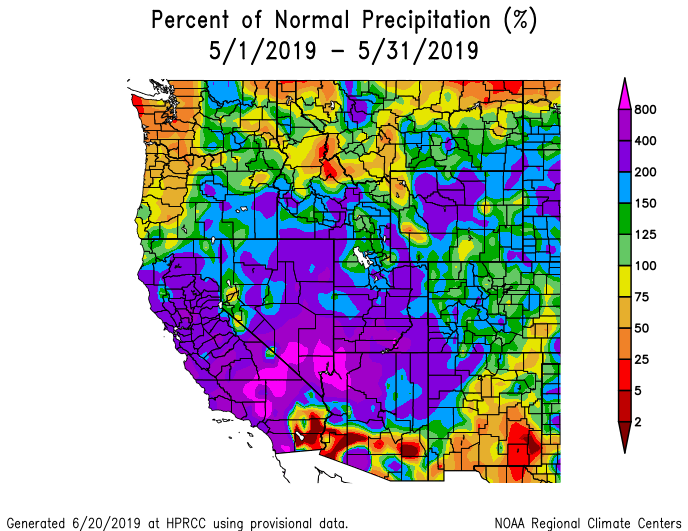
May was another pleasant surprise in the weather department. Except for the southeast corner of the state which was dryer, we experienced normal to above normal precipitation. In the Southwest it was even more with another 150% - 300% of normal month. In May we documented 4 storms brining 5.7” of water (the average is 3.2”). Along with these storms were 4 DOS events. As the plots below will show, the period from March thru May was extremely wet overall. 18 out of 31 days in May we recorded precipitation at SBB. And as we will discuss below this not only added to a hefty snowpack but also allowed the snow to warm and melt at a slower rate.
June-July:
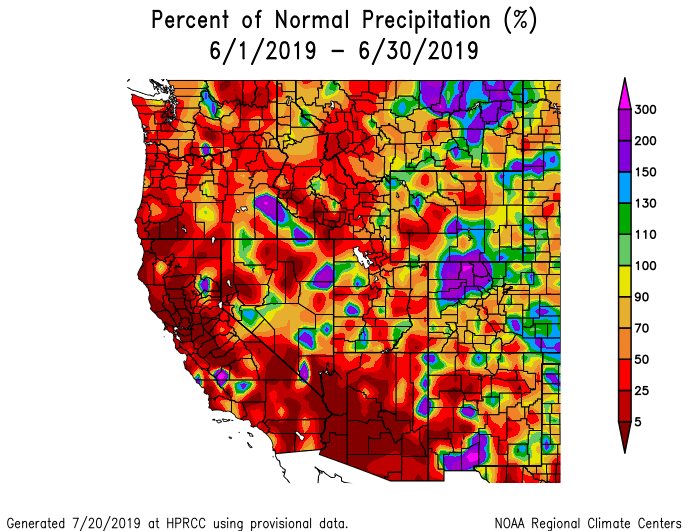
June was another pleasant near or below normal month in terms of air temperature statewide. It was largely dryer except for the northwest and southeast corner of the state. Colorado fared much better than the rest of the West which experienced very dry conditions. June saw 1.4” water at SBB which is near normal. We documented 1 storm and had 9 days with recorded precipitation.

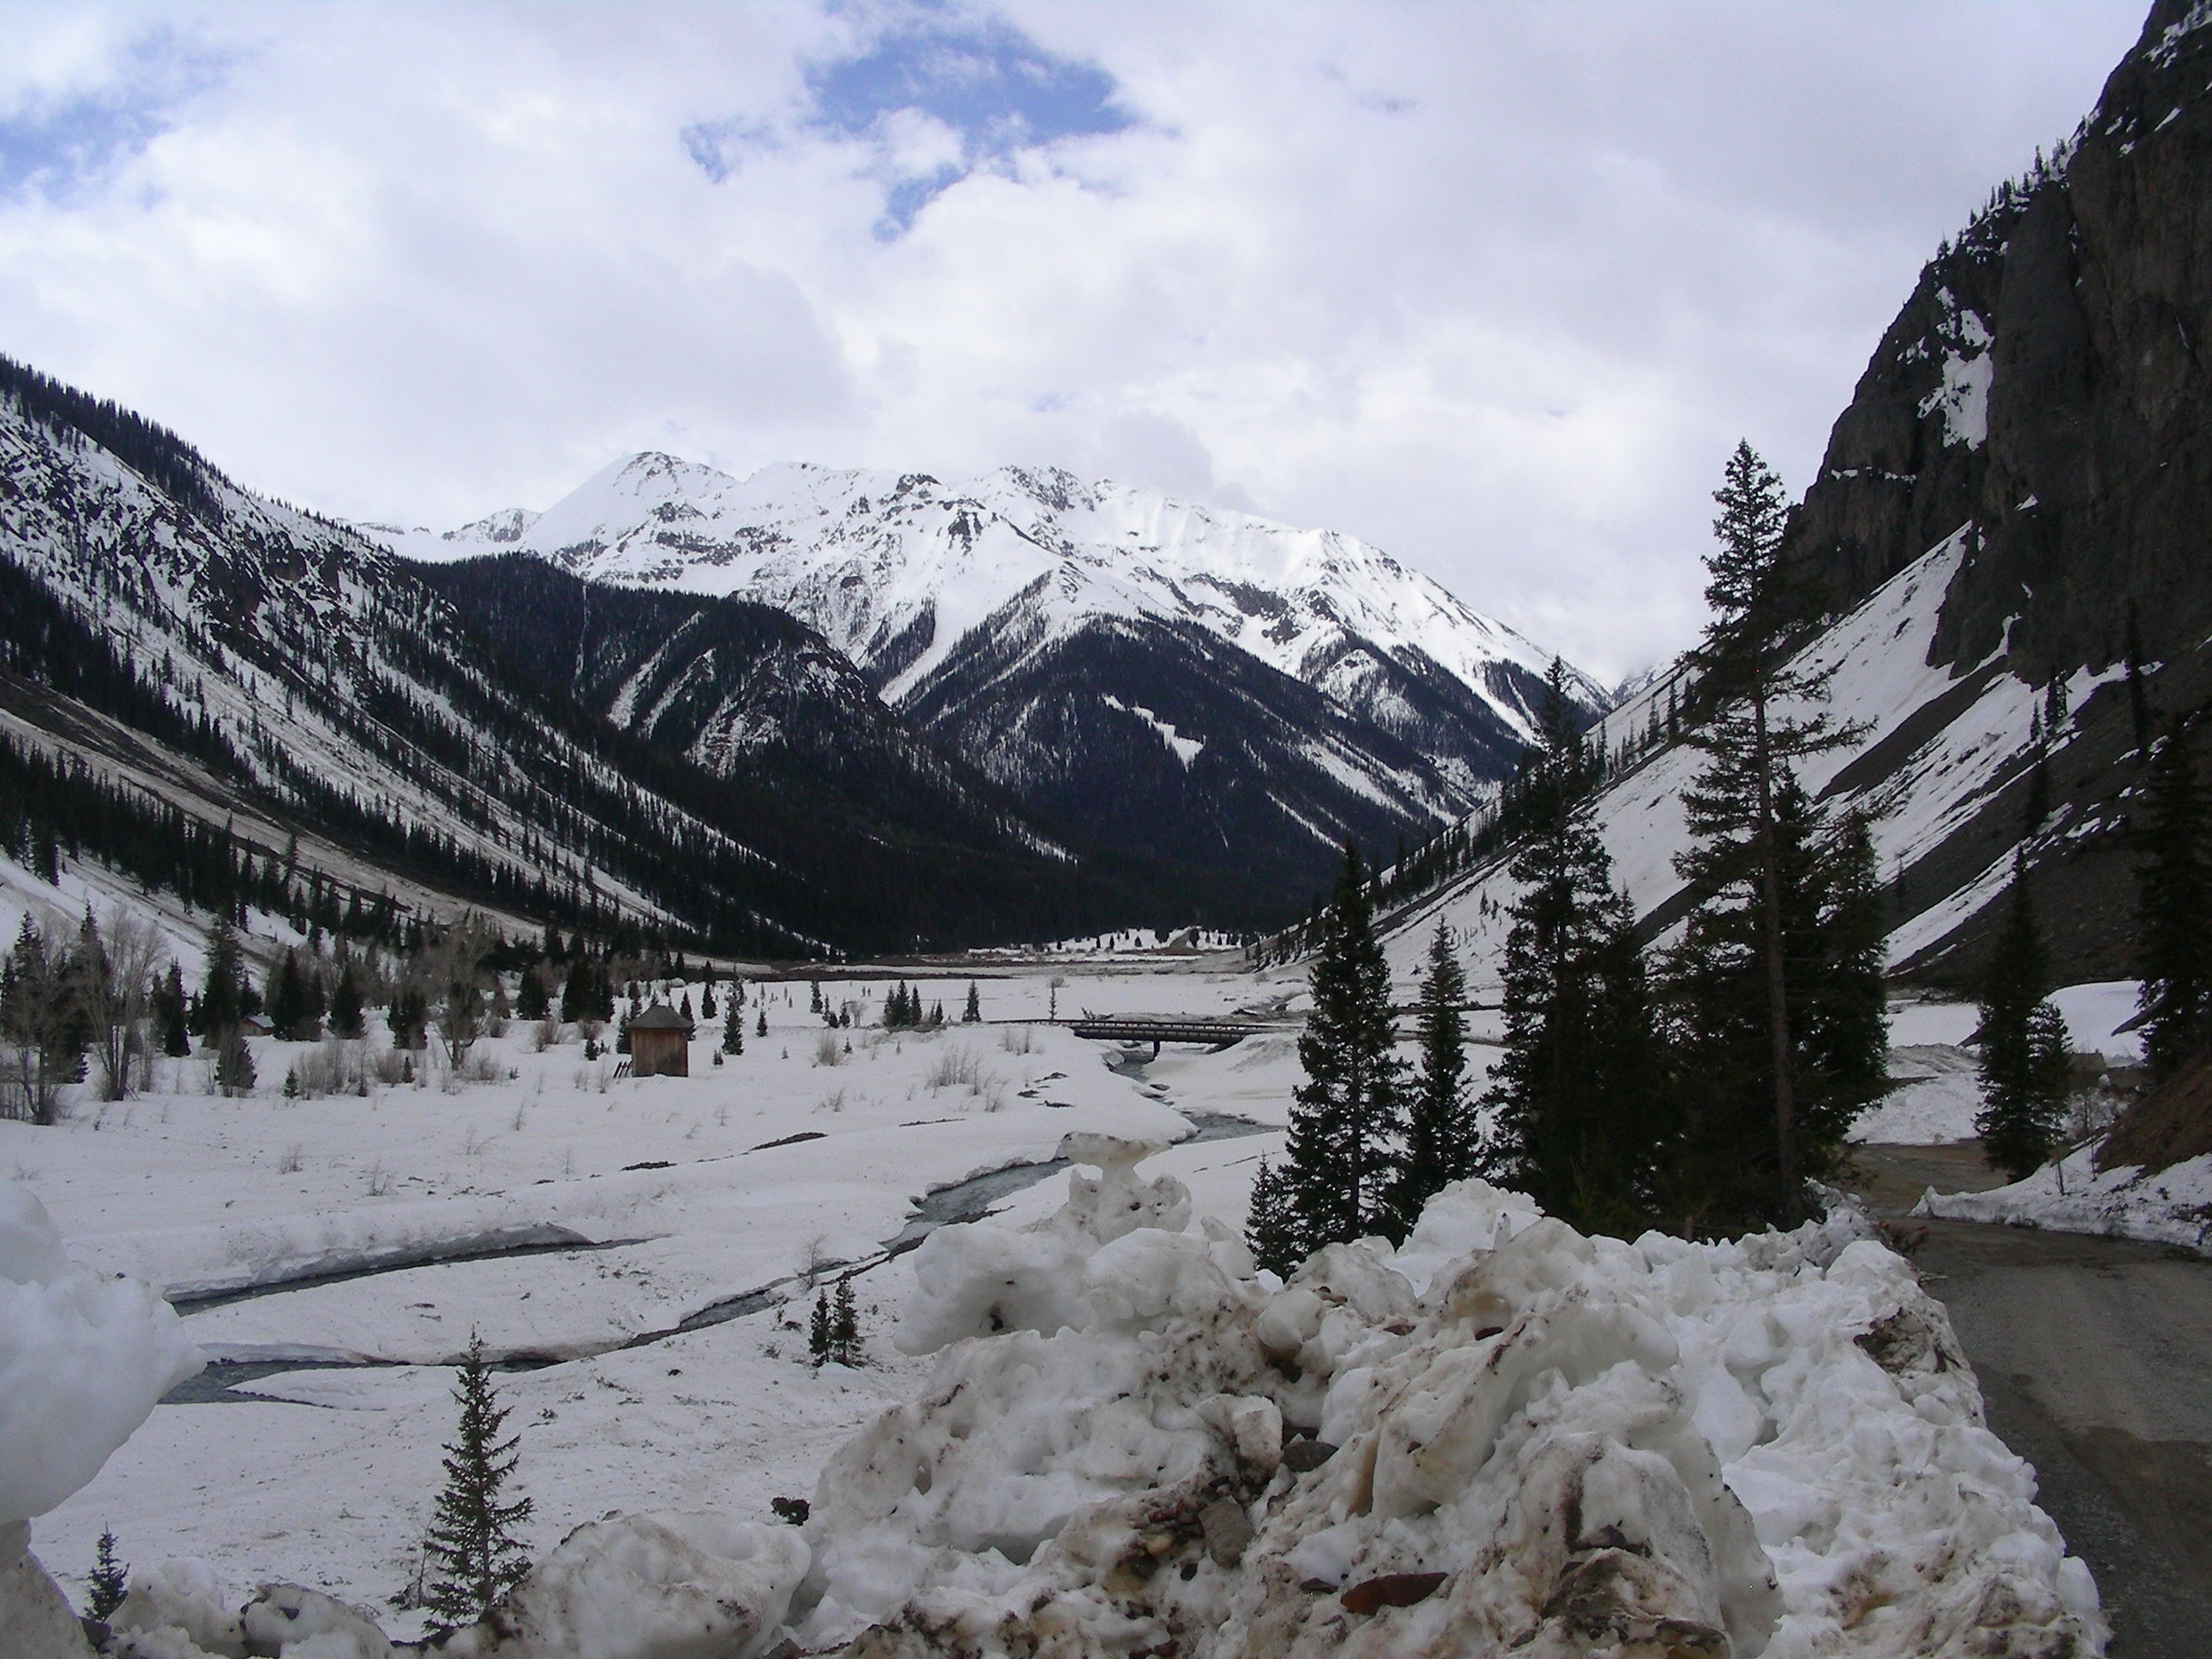


Above are photos documenting the epic avalanche cycle in March 2019.


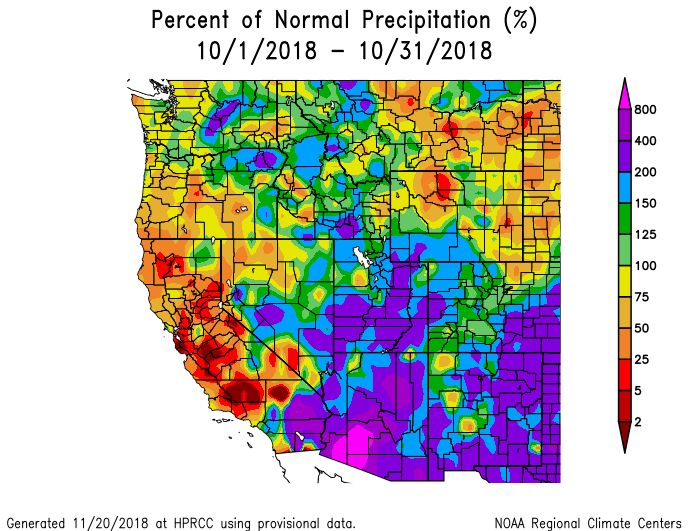
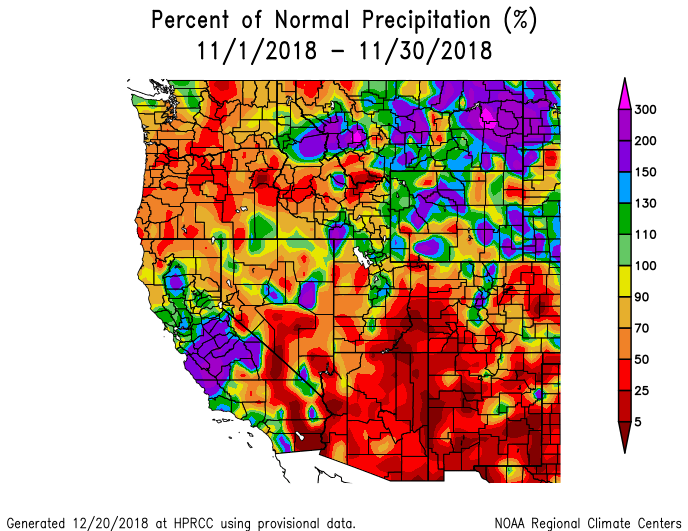
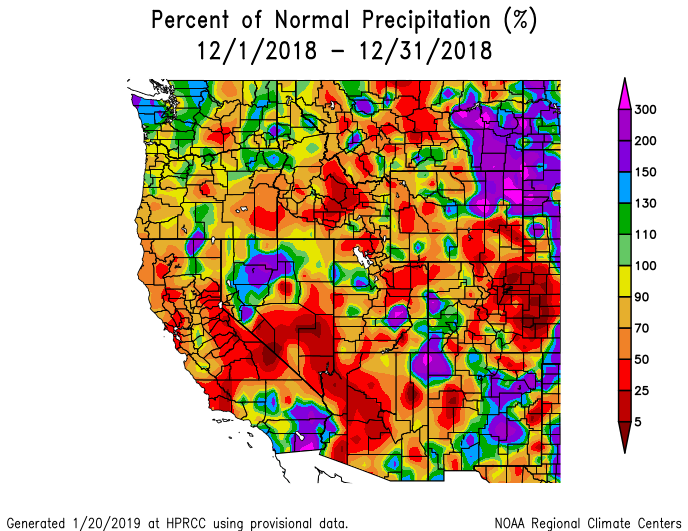



SENATOR BECK STUDY BASIN DATA
This section describes conditions and data collected by the Center for Snow and Avalanche Studies at our Senator Beck Basin Study Area (SBB) at Red Mountain Pass under our Mountain System Monitoring program, which includes the CODOS program. At SBB, snowpack, weather, soils, and radiation conditions are monitored and measured at the well-sheltered subalpine Swamp Angel Study Plot (SASP, 11,060’) and at the more exposed, alpine Senator Beck Study Plot (SBSP, 12,180’). Nearby, wind speed, wind direction, air temperature, and humidity data are collected at the Putney Study Plot (PTSP, 12,323’), located to minimize the influence of local terrain on those measurements. Finally, SBB streamflow discharge is continuously measured at the SBB pour point at the Senator Beck Stream Gauge (SBSG, 11,030’), in a broad-crested, notched weir.
The winter started well for most of Colorado and lesser so for Southwestern Colorado. In October we recorded 20 days with precipitation along with the first 6 days of November. In October - December we documented 7 storms but in November/December they did not produce the amount of precipitation we needed. Permanent snowcover in over 50% of SBB was established in latter October and Nov 4-5 we observed our first winter storm (at least 12 mm (0.47″) of precipitation with no break in precipitation longer than 12 hours). All total we received 29 storms this winter, the average is around 24. Winter storm reports can be viewed at the snowstudies.org website.
The above graph shows precipitation with snow depth at SASP and SBSP. November and December were well below average precipitation and April was near normal, the rest of the winter months were well above normal.
Water Year 2019 cumulative precipitation, through the month of August is currently 116% of our period of record average.
In WY2018 2/3 of all daily air temperatures were above the mean. In what is a nice surprise, in WY2019 from October 1 - August 30, 151 days were above the mean and 183 days were below.
SNOWPACK CONDITIONS
We went into 2018/2019 snow season as always, not really knowing what is going to happen. Starting off in neutral El Nino conditions with a 70-75% chance of mild El Nino conditions forming and the long range forecast calling for a pattern shift from the strong blocking pattern - routing storm tracks north and locking in extensive dry/warm conditions for Colorado - that we experienced in WY2018 at least gave a reason to hope for a more normal snow season.
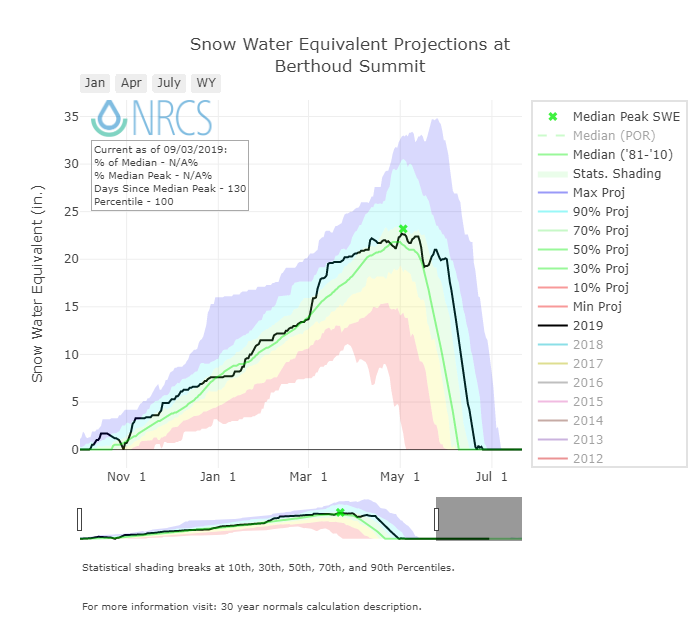
Colorado as whole accumulated snow right near the median line starting in November to mid-February. This held true for Northern and Central Basins but for the San Miguel-Dolores-Animas-San Juan River Basins and Rio Grande things got off to a slow start in terms of the productiveness of storms but rebounded to be near median snowpack starting the last week of January. Starting the second week of February the Southern Basins snowpack soared as storms started favoring the Central and Southern half of the state. This sharp increase in snowpack continued until the end of March when the storm severity let up a little bit and we rolled into a more average (but warmer) month of April. With April 1st being the general timeframe that many regions reach peak SWE we see the snowpack warming and melt at lower elevations and stream gauges starting to kick into gear. Except for WY2018 the month of May has been wetter than normal for the past few years and this year continued the trend. At SBB we observed close to double the average precipitation for May. Of course this added to an already big snowpack and with 18 days of recorded precipitation slowed snow melt rates with many streams dipping in their usual streamflow amounts until the last few days of May when nicer weather conditions returned. The snow hydrograph shows a bump in SWE the first part of May when we received our normal months precipitation in the first 8 days of the month, then again for storm #27 from the 19th-23rd. In June, being June and all, snowmelt of the big snowpack quickened its pace. Besides the Northwest corner of the state it was relatively dry but near normal temperatures. It took some time to melt the snowpack where at higher elevations just slightly below peak SWE conditions remained until very late. The result was for Colorado as a whole complete snow ablation was ~2 weeks later than normal and a week longer than that in many regions. At SASP (11,060’) snow was gone on June 25. At SBSP (12,186’) snow ablation occurred on July 11 at the station but there was still a good amount of snow mid-August at these higher elevations. So much so we had to postpone our 5-year repeat plant ecology inventory in the Basin until next summer.


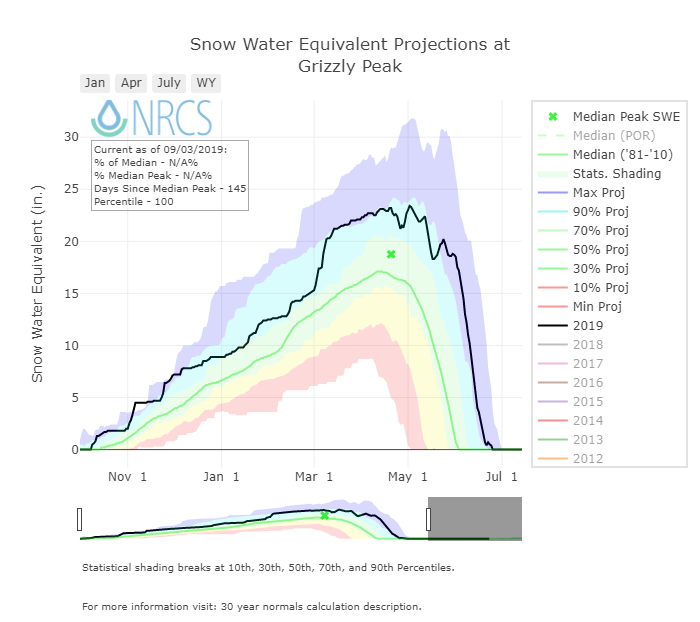


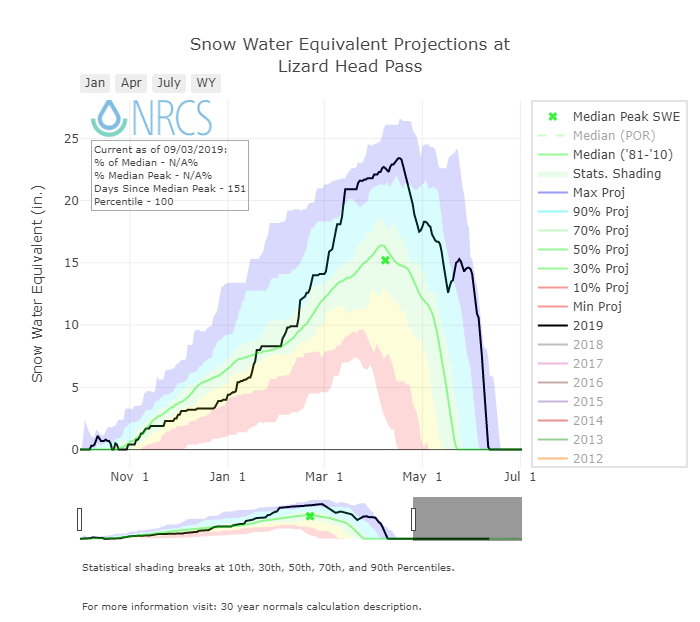
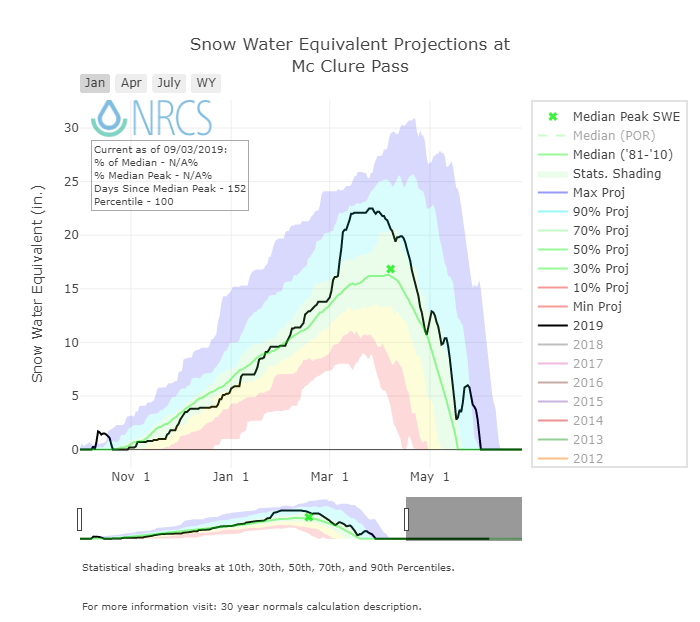
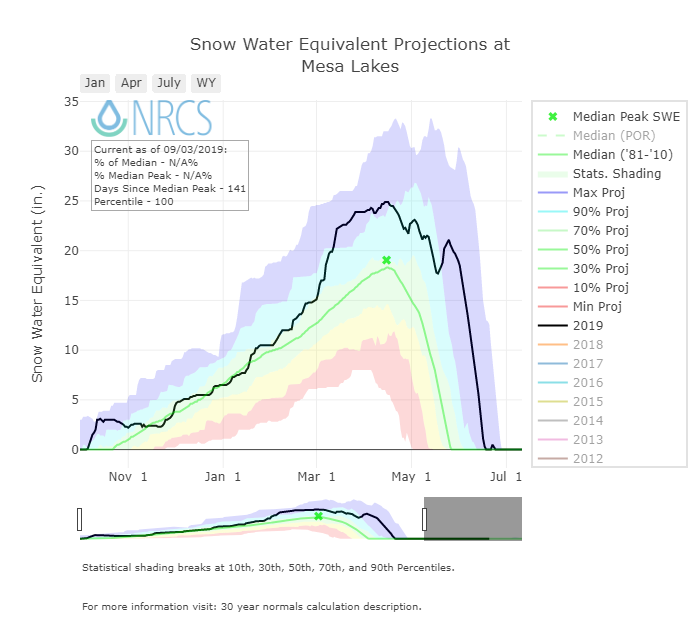
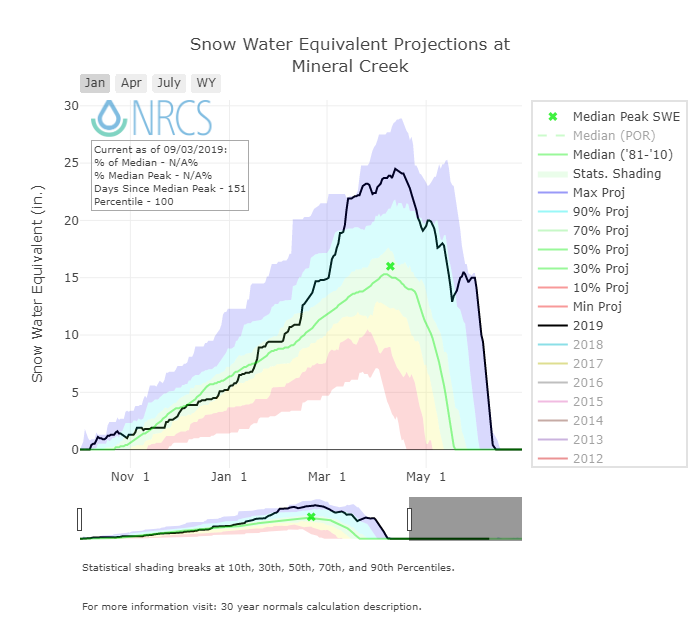
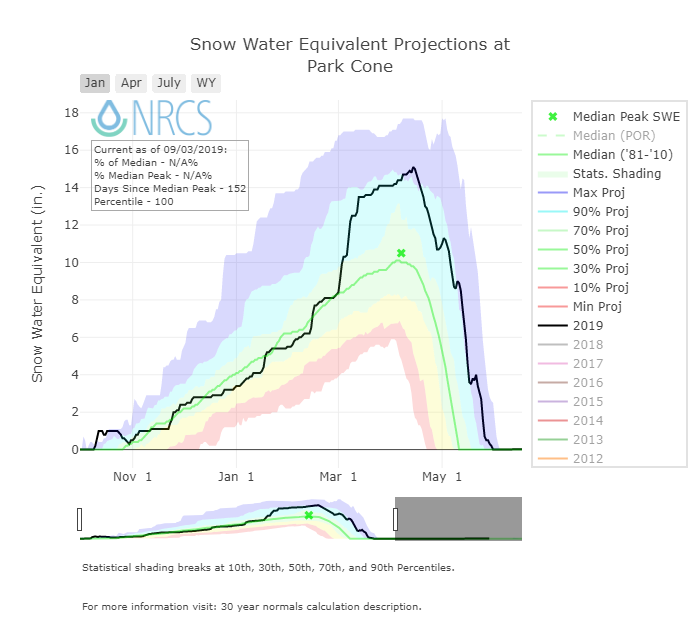

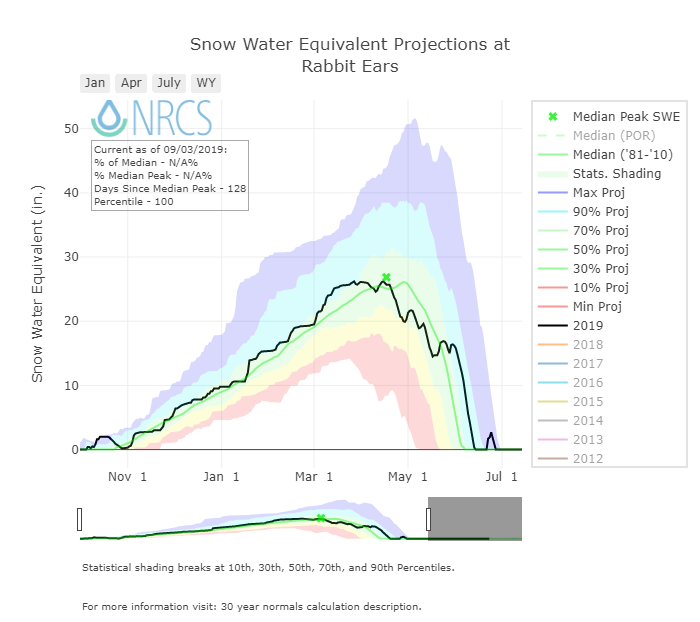
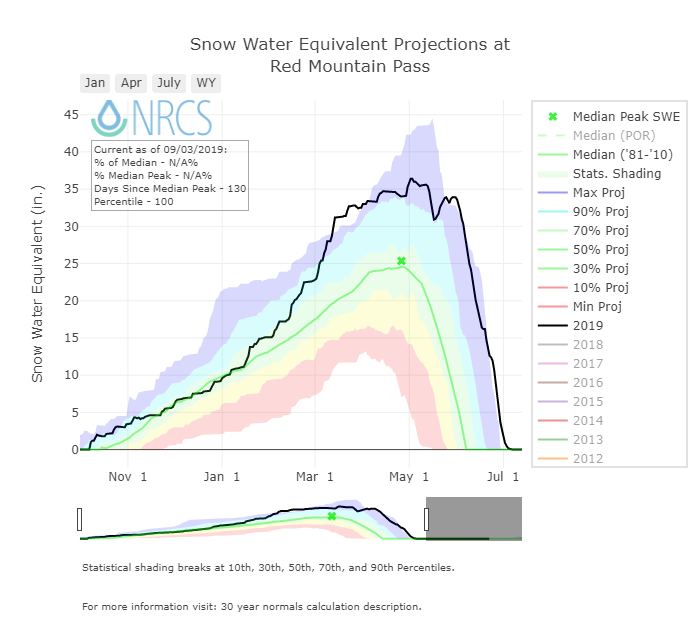

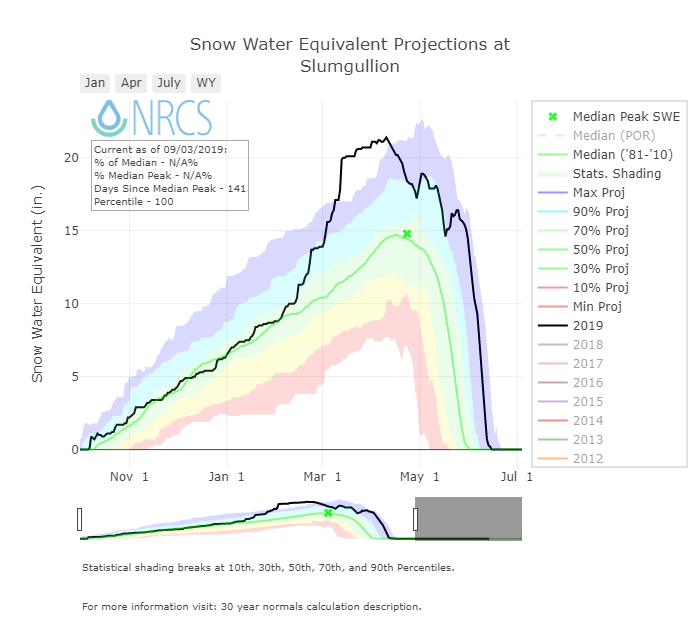
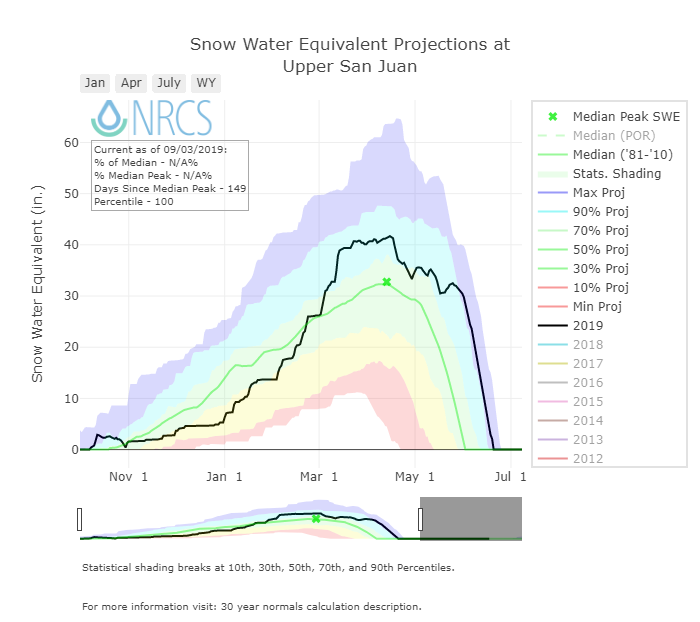
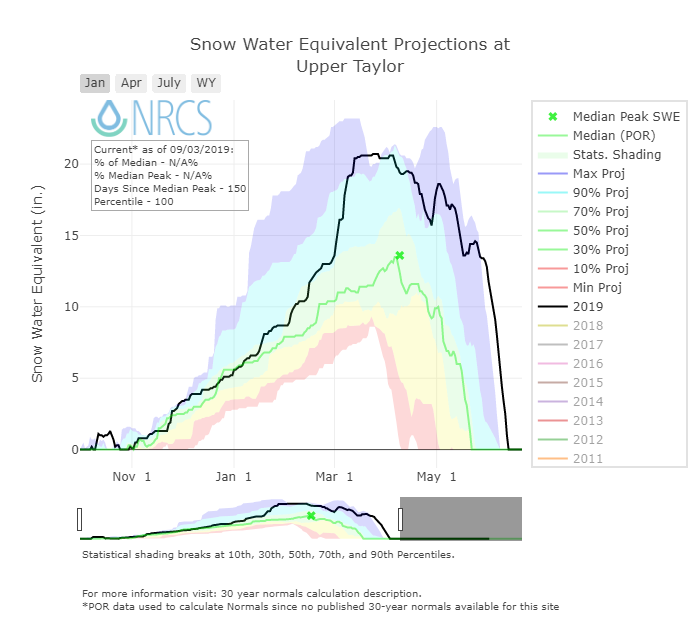
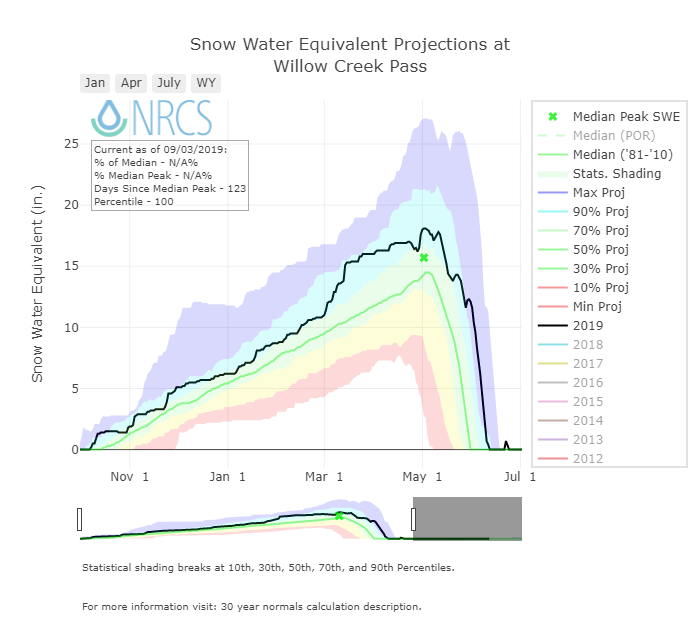

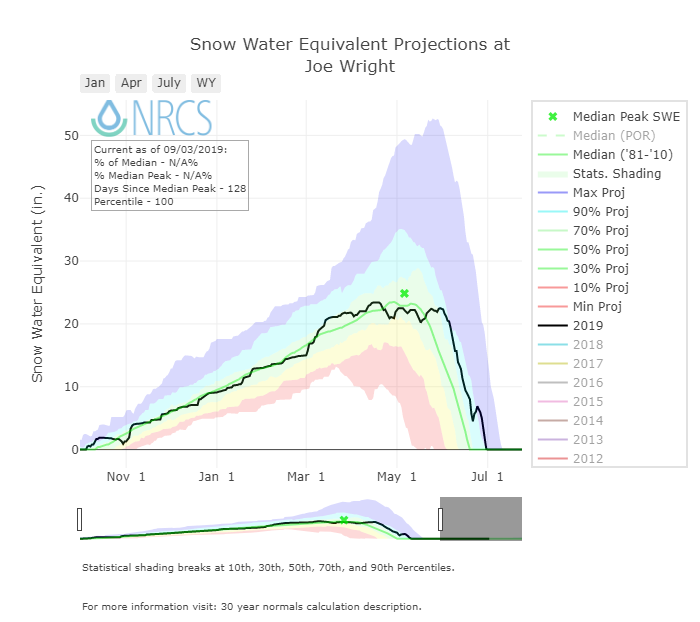


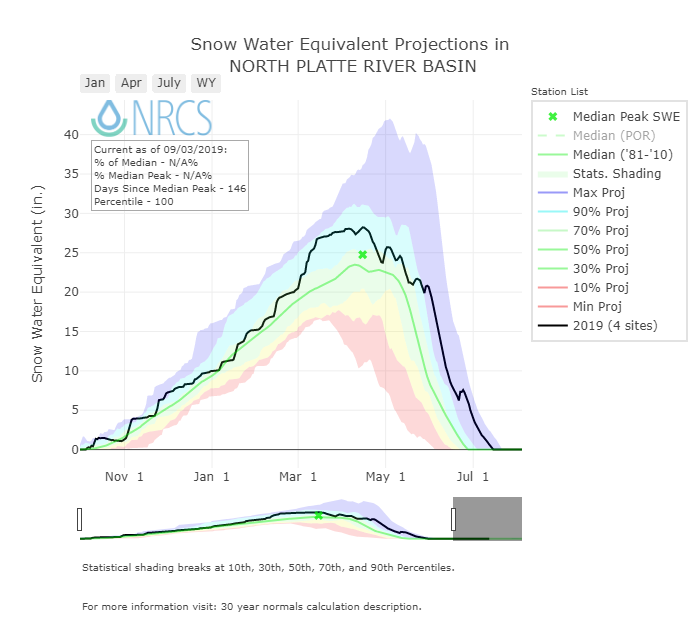


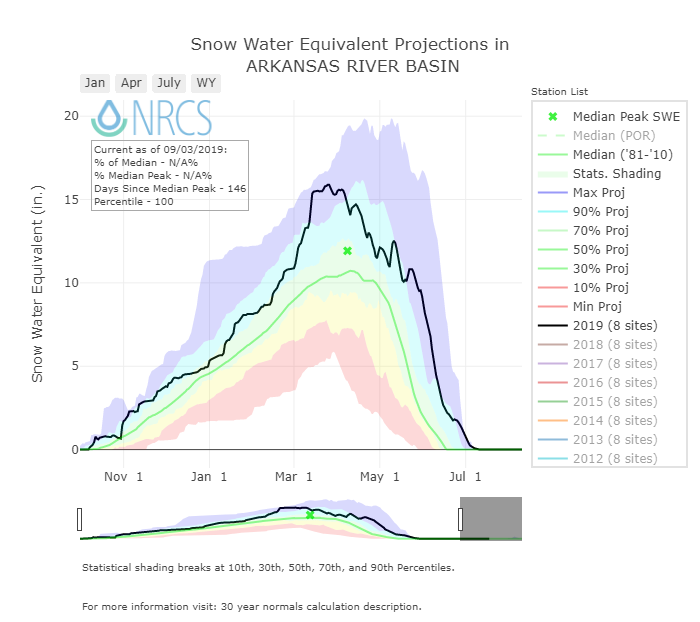

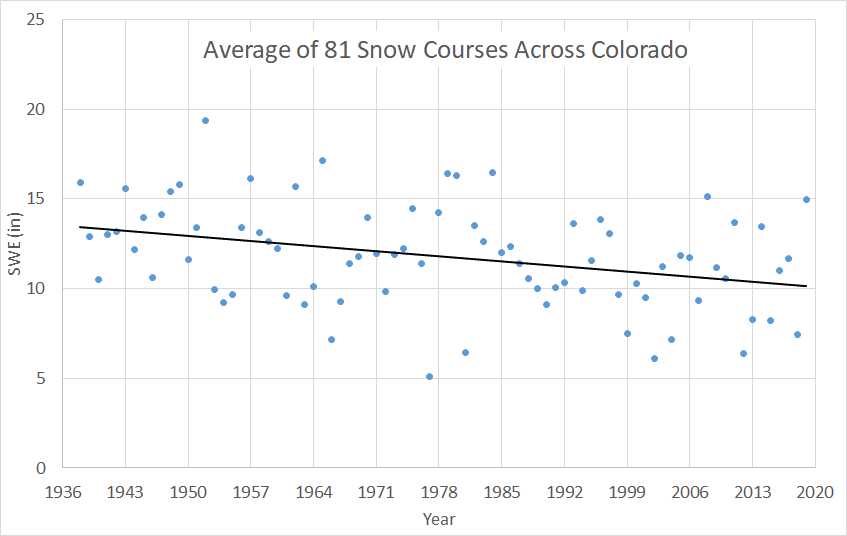
The plots below show snow course data for the state of Colorado. The snow course plots show data for stations in and near the San Juan Mountains. In Colorado, many snow courses were established in the 1930’s/40’s, a data record of ~80 years. Snow courses are manual measurements collected with a Federal Sampler which, by weighing the Sampler containing a core from the snowpack, directly translates to inches of water in that column of snow. Snow courses usually involve ~10-15 SWE measurements over a transect so the averaged SWE value that is reported contains at least some component of the spatial variability of the landscape. Snow course data are usually only collected at the first of the month during the spring (low temporal resolution). Automated SNOTEL stations on the other hand report on a daily basis, so you can look at the data on the computer every morning and see how bad/good the snowpack is doing. SNOTEL SWE data is point data, meaning the SWE value comes from a “pillow” that essentially weighs the overlaying mass of snow (no integration of spatial variability). SNOTEL stations collect other beneficial information like precipitation, air temperature, snow depth, wind speed/direction. Many SNOTEL stations were established near snow course sites to correlate data records. Now that many SNOTEL stations have been in place 30-40 years, the data seems to be used and referenced much more frequently than snow course data, but is important to consider the value of snow course data.


Above: By April 1st the snowpack was at record amounts for most stations in Central and Southern Colorado and even a few in Northern Colorado. Most stations reported this year being in the top 5 wettest winters in their period of record. Most SNOTEL stations now have a period of record over 30 years. It is even more impressive when considering snowcourse data (the squares indicate snowcourses and the circles are SNOTEL stations) that can have a 80-90 year period of record.
Below: Summary data for WY2019 at the 16 SNOTEL stations that CODOS monitors. The table shows peak SWE, and calculated from the day of peak SWE, melt rates, days to snow-all-gone, and mean temperature.
Below. A summary of WY 2006-2019 snowmelt rates and associated conditions at the 16 SNOTEL stations that CODOS routinely monitors, statewide. Days to SAG refers to the time between peak SWE and “snow all gone” at the SNOTEL sites. Adjusted Daily Mean Loss calculates the rate of snowmelt following peak SWE, including all precipitation received after peak SWE (assumed to be snow). Melt rate tables are presented for each of the 11 CODOS monitoring sites on their webpages.
Snow depth at Swamp Angel Study Plot. Full snow ablation occurred around June 25.
Snow depth at Senator Beck Study Plot. Full snow ablation occurred July 11 at SBSP but a lot of snow remained until very late in the season above treeline.
Snow water equivalent at Swamp Angel. Peak SWE was 35.6” occurring on May 5 and May 27.
Snow water equivalent at Senator Beck Study Plot. Peak SWE 36.7” occurring around June 3.
DUST-ON-SNOW CONDITIONS
DUST ENHANCED RUNOFF CLASSIFICATION:
In Water Year 2015 CODOS introduced a Dust Enhanced Runoff Classification (DERC) approach to linking dust-on-snow, snowpack, and spring weather conditions to patterns in statewide hydrographs within a 3x3x3 Dust Enhanced Runoff Space. The below table presents the final DERC classification of WY2019 parameters at each of the 20 stream gauges monitored by CODOS. Water Years 2006-2019 classifications are contained in Excel workbook Runoff_Space_by_Region_and_WY.xlsx. Another workbook, Runoff_Space_by_Watershed.xlsx, contains individual DERC analyses for WY 2006-2019 for each of the 20 stream gauges.
A conceptual Dust Enhanced Snowmelt Runoff Space integrating the interactions of March 1 SWE, dust intensity, and spring precipitation.
Below. Based on the discussions describing the DERC approach in characterizing the watersheds that CODOS monitors, WY2019 snowmelt season conditions are summarized in the tables below. Essentially, Colorado WY2019 snowmelt runoff behaviors fell into general patterns of “Average Dust”, mostly “High" March 1 SWE, and mostly “Wet” spring.
The Senator Beck Basin received 7 dust events this season, with some of the events being very significant in their dust loading. D1 and D2 were light events and D3 moderate. Dust event D5 was a particularly dark and concentrated layer. D6 were also an obvious band of dirt in the snowpack of moderate severity. But it was the coelecsing of these dust events that resulted in a dirty snow surface once full emergence occurred. D3-D7 was deposited between April 9 - May 23, keeping the dust near the surface to emerge soon after snow ablation began. At the time of peak SWE, May 23, the top 1.6’ of the snow held all the dust layers. But it all played out in a near perfect manner, there were many storm events to briefly cover dust and regular overcast days to reduce radiation input to the snowpack. This led to a more measured release of meltwater, albeit extending well into summer, in the mountains across the state.
Even though Southwest Mountains had a pretty dirty snow surface once fully emerged it was still in the realm of the norm for that region. We are classifying this year as “Average” within the DERC framework for dust loading in the SBB as well as statewide this season. In Southwest Colorado our dust loading was towards the heavy end of average, while in the Front Range we saw dust conditions toward middle average. The central and northern mountains fell squarely in the middle of the average category.
Total dust-on-snow events by month. March begins the more intensive part of dust-on-snow season. In WY2019, 5 of the 7 dust events occurred after April 1st, placing those dust layers within the upper portion of the snowpack.
Total dust-on-snow events by year. Five dust events in 2018/2019 were “wet” events, accompanied with precipitation. Two events was “dry”, occurring without precipitation or just prior to precipitation.
Variance of combined March, April, and May precipitation as of June 1, 2019, for the SNOTEL stations adjacent to or near CODOS monitoring sites.
All of the mountainous parts of the state experienced a wet spring, with 10 of the 15 stations in the plot above receiving more than 50% of their median March-May precipitation. The lowest % increase in precipitation was 19% at Rabbit Ears Pass, still well above average. Additionally, almost every site monitored by CODOS met our "High" March 1 SWE requirement, where the normal range is within +/-10% of median March 1 SWE. Four sites fell into the "Average" category, Taylor Fork, Frasier River, Yamps River, and Muddy Creek. To sum it up, the majority of Colorado’s mountains had a well above average winter, with some places receiving some of the highest recorded snowfall in decades.
RUNOFF BEHAVIOR
One of the biggest questions as the snowpack accumulated was, given the severe soil moisture deficit, just how much melt water would make it to the streams and how much would go towards replenishing the thirsty soils. Indeed baseflows were extremely low going into the winter season and continued being below normal through winter. By April early season and lower elevation melt was starting and most streams started showing a rebound to near normal levels. Soil moisture recharge is a gradual process but it appears at elevations holding snowpack there was plenty of it to go around.
April through mid-March the hydrograph more or less hovered around median. A sunny/dry first week of April was followed by a stormy period April 9-14 that provided decreased incoming solar radiation and decreasing streamflows. Dust exposure of D3 began following the April storm. Another storm occurred April 29-May 1 resulted in another fresh snow surface and reduced flows going into May.
Just as streamflows were on the rise again another storm hit May 8-10 and then again May 16-18 (yet another tap on the snowmelt brakes). A storm May 26-30 kept a lid on things until the end of the month then sunny/warm conditions returned, which meant a surge in streamflows and D3-D6 exposure increasing the surge. Not soon after a new dust event and the snowpack melting down to D2 meant D2-D7 were now on the surface darkening it further. A stormy period June 15-22 essentially made streamflows hold steady and decrease a bit before, in late June, summer conditions with exposed dust resulted in peak flows the end of June for many basins. Depending the watershed size and % of higher elevation contributing area, streams peaked either during the 2nd week of June timeframe or the second streamflow surge around July 1 (with some streams peaking the first week of July). The hydrographs below show a good example of these different scenarios.
At SBB peak discharge occurred on July 1, 30 days later than the median peak date of June 2 (compare with 17 days earlier than median in WY2018). Typically, the first streamflow peak at SBB occurs when snow has reached all-gone status at SASP (11,060') and the second peak when SBSP (12,200') has reached snow-gone, with this second peak representing the contribution from higher elevations. However in this extreme year SASP reported snow gone on June 25 SASP at the snow depth sensor, 10 days later than the first peak. At SBSP snow was all gone July 11, again 10 days later than the second, and highest, peak discharge of 21 cfs on July 1. Please see SBB streamflow graph below.
This meant that many water managers had their hands full managing the quantity and timing of these flows. But to my knowledge all reservoirs were able to fill this year without incident, even rather unexpectedly Blue Mesa Reservoir, which is quite an accomplishment with water storage being at record low levels going into spring from dismal WY2018.
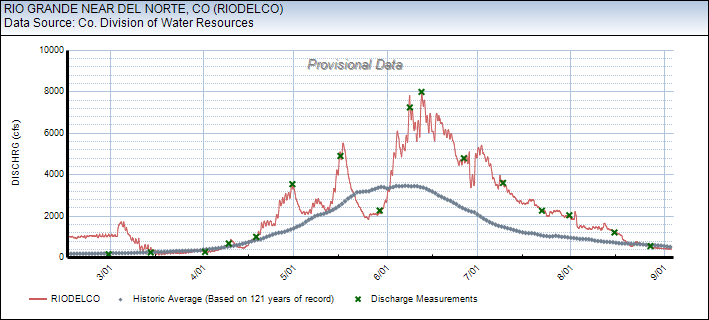
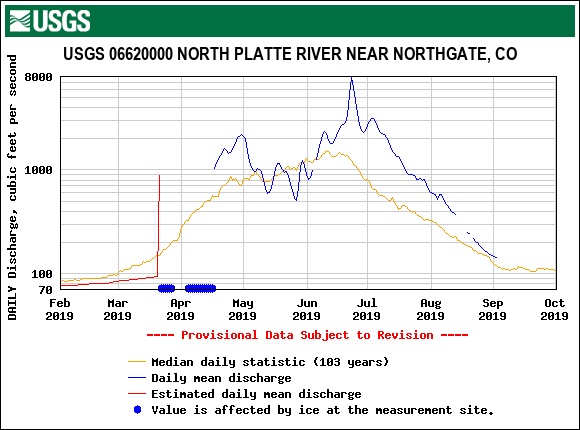
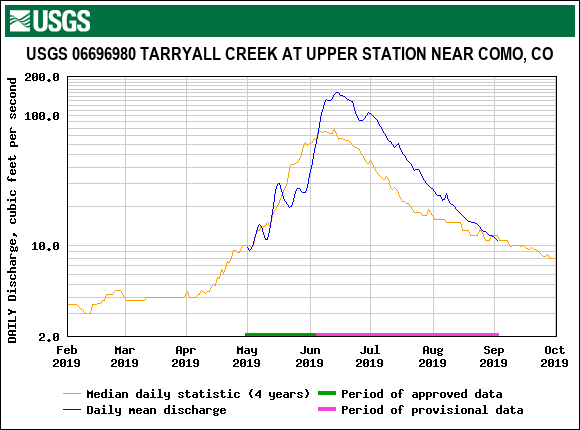
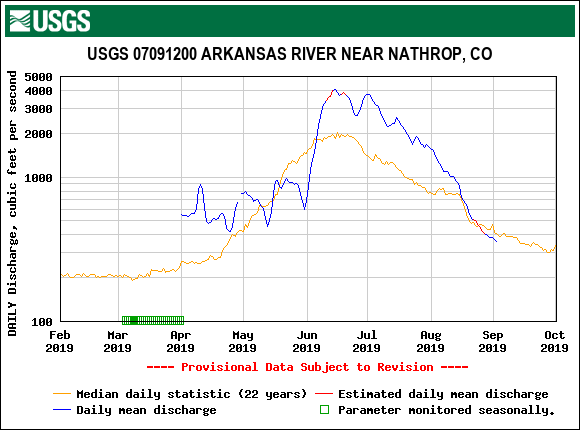
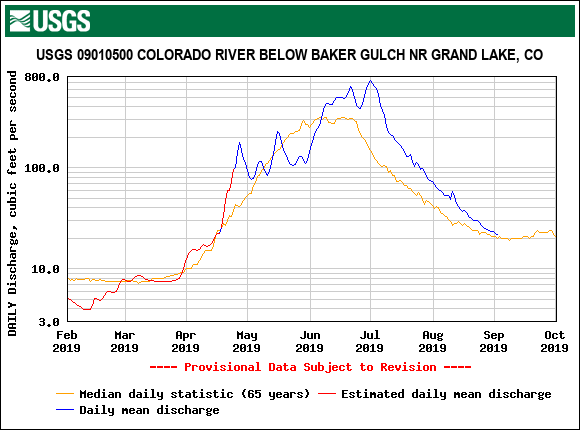
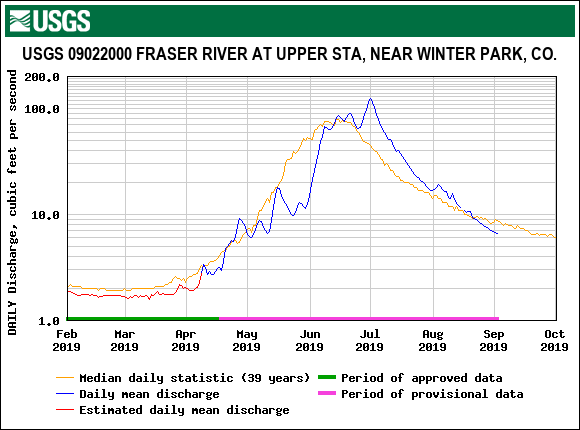
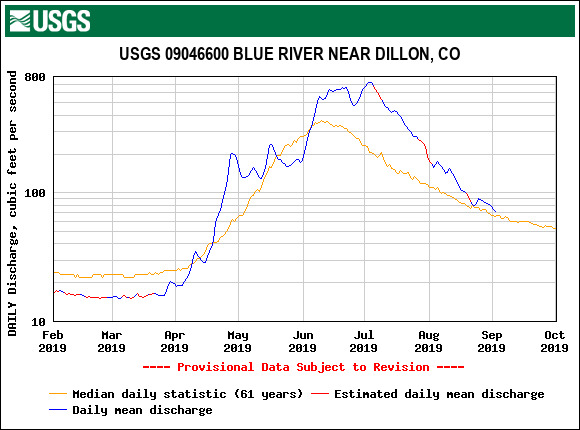
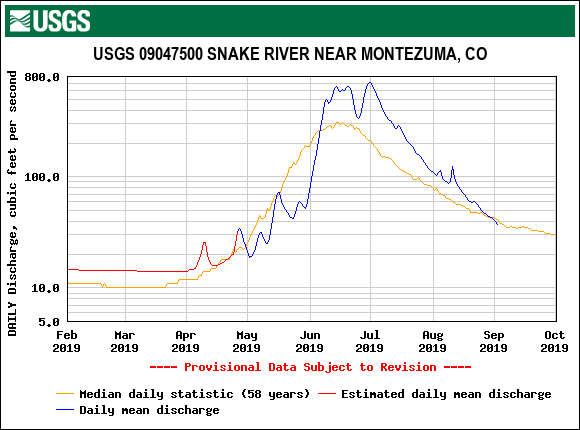
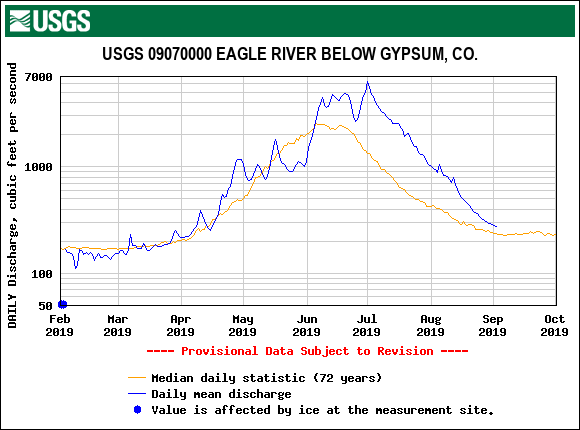
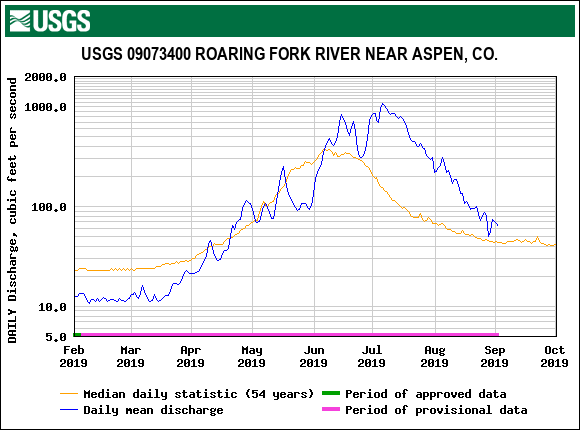
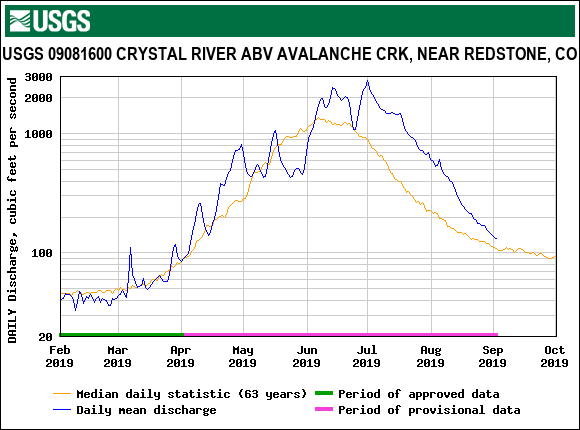
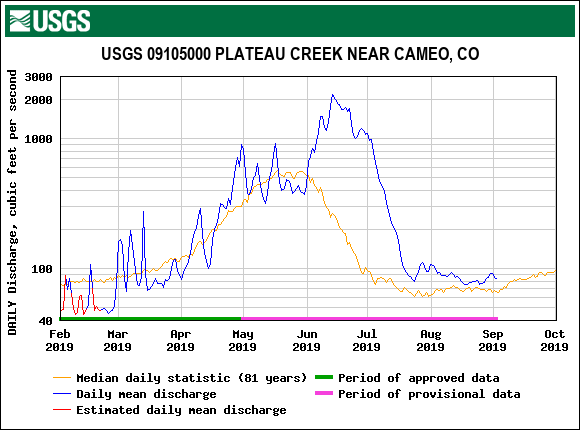

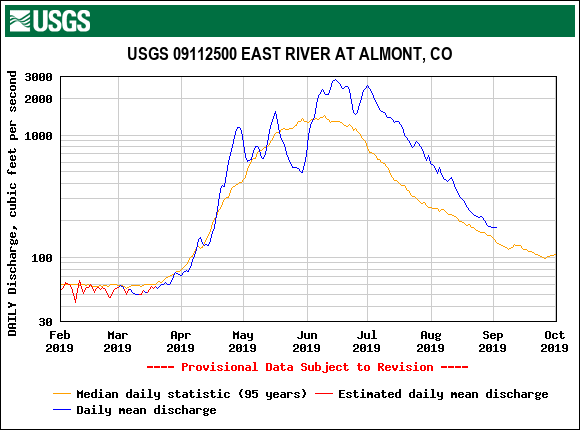
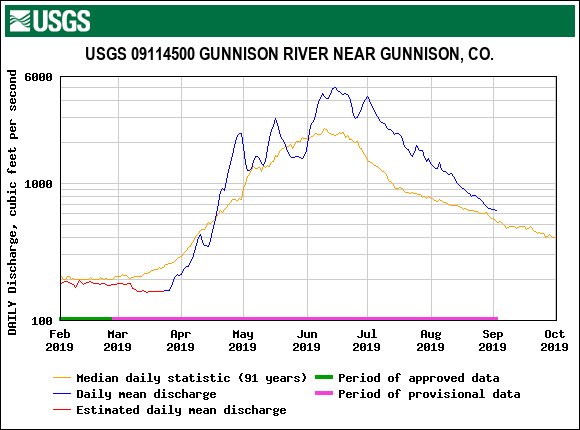
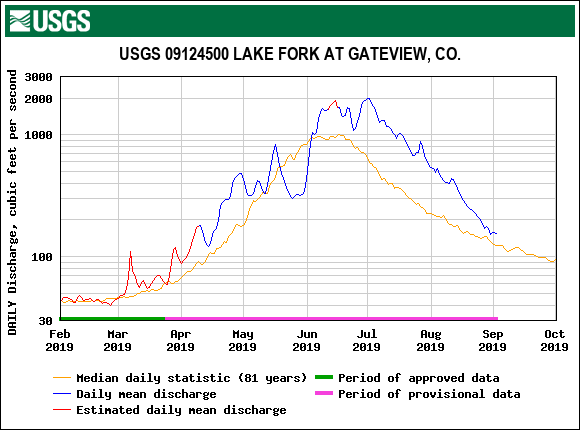
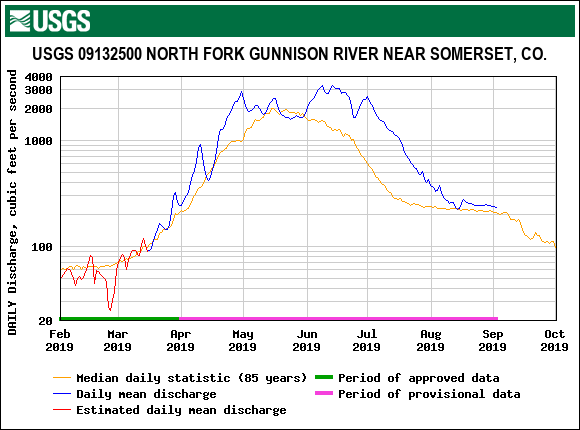
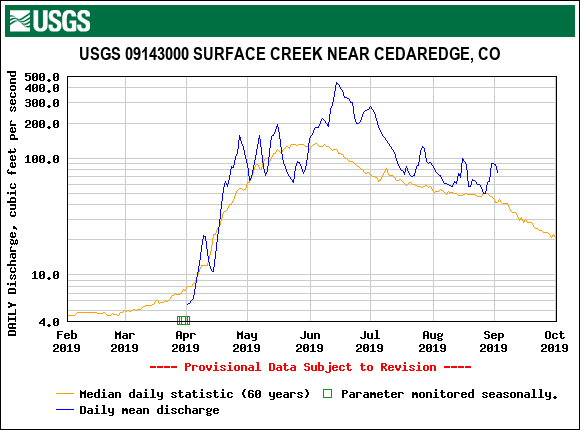
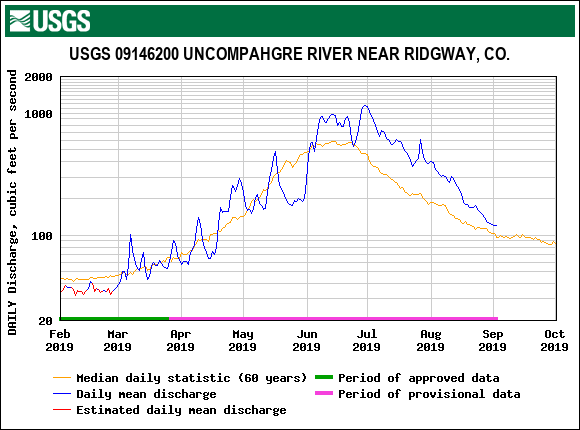
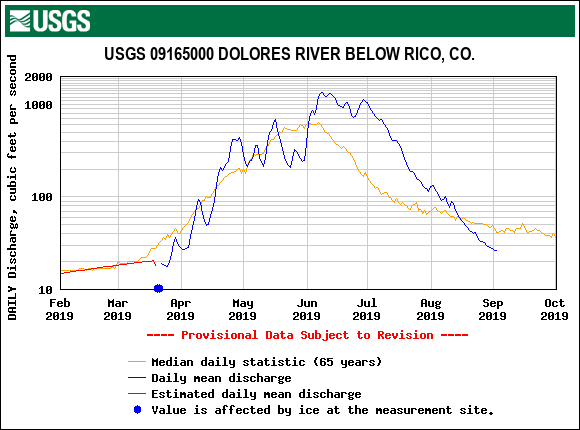
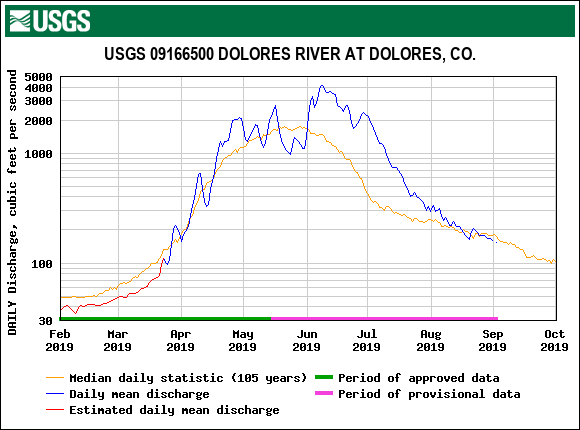
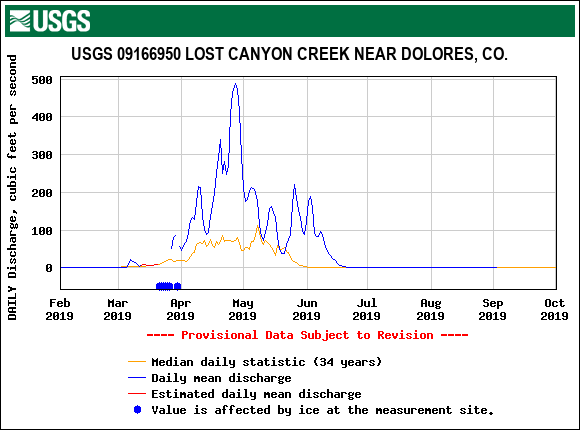
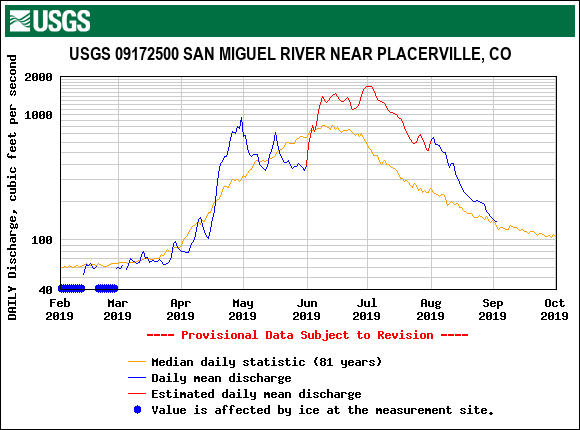
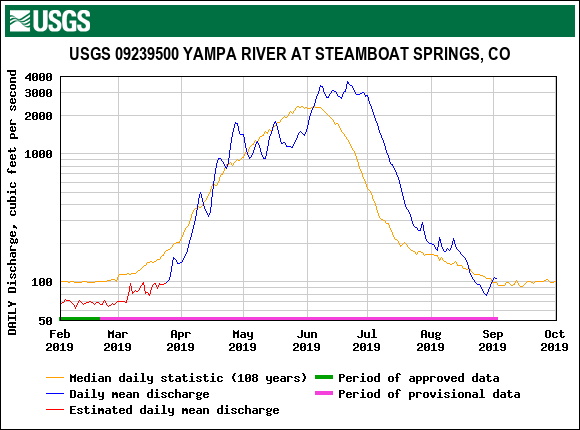
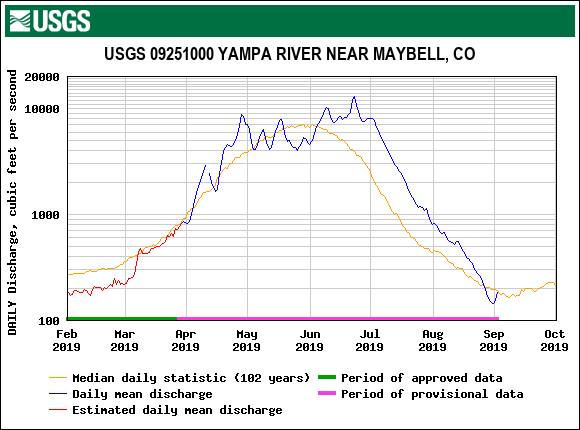
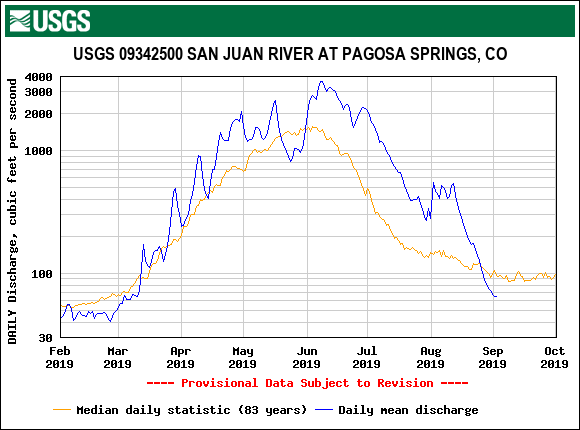
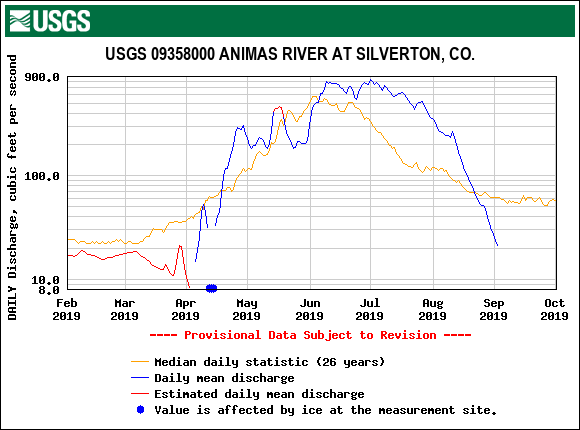
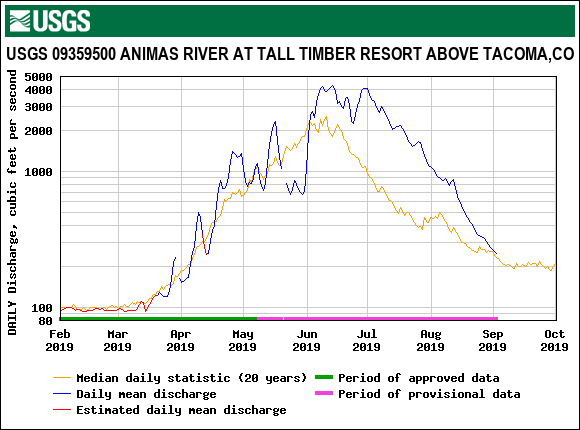
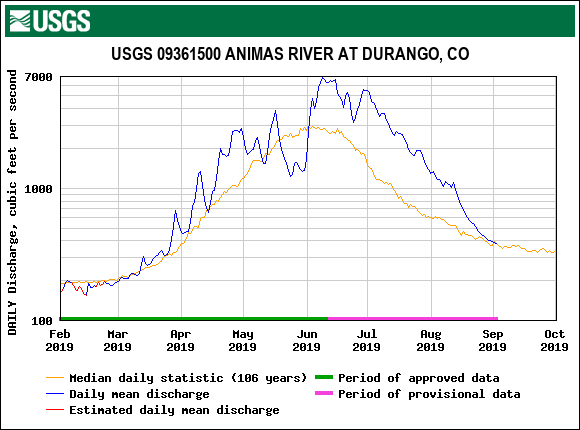


Cumulative streamflow for WY2019 is the highest in our period of record.


LOOKING AHEAD
Currently, stream gauges are near normal flows as a holdover from the large, late season snowpack. The summer has been a dry and very warm. Many areas have not seen the usual monsoon activity resulting in even drier conditions.
El Niño Southern Oscilation (ENSO) is a periodic fluctuation in sea surface temperature and the air pressure of the overlying atmosphere across the equatorial Pacific Ocean. ENSO predictions and what it might mean for the 2019/20 snowpack are taking shape. Many of the model predictions issued during mid-August 2019 show above-average but ENSO-neutral conditions continuing through the fall and into winter, while a somewhat smaller number of models show weak El Niño conditions redeveloping by late fall. Very few models predict La Niña. El Niño can mean more precipitation for Colorado.
Current long-term outlooks are suggesting the remaining summer and fall will be warmer than average with an increased chance of precipitation.


