

Greetings from Silverton,
As it started raining early last night and continued throughout the evening here in Silverton (this morning it is slowly turning to wet snow) I could not avoid the feeling that spring is really trying to rush things a bit. Add the scant snowcover and muddy streets and it definitely feels like late May and not late March. These conditions lead me to think of snow melt and streamflow and what could unfold this runoff season. In many areas of Colorado this snow season is being compared to the notorious low snowpack of WY2002, and indeed considering the graphs below WY2018 is tracking WY2002 snow conditions very closely. With this shot of precipitation we are currently receiving, and a bit going into next week, it is looking like we may be slightly be above WY2002 conditions statewide by April 1. Keeping a similar train of thought as in the March 9 CODOS Update the cumulative streamflow plots below show what unfolded in WY2002, and may give a sense of what we could see this year. In our CODOS report last week we included a table of snowpack temperatures from our March 14-17 tour. Results were generally comparable to the last four out of five years.
The one-month forecast remains boring. Colorado saw some decent storms this past week as we issued two storm reports for Senator Beck, and the 7-day outlook indicates ~1” of potential precipitation in the mountains, but the one-month outlook still calls for warms temperatures and below average chance of precipitation. See forecast images below.
DUST: High winds in Utah on a couple different occasions this week had us wondering if we would see dust in the Colorado mountains. The snowpack at SASP did not reveal any new dust and D2 is still at least 12" below surface. We will keep an eye out and report any new developments ASAP. It will be interesting to see how these next couple of months develop in terms of spring weather, dust conditions, and resultant streamflow. Will we see some gains in snowpack going into April? If spring is warm and dry, how early will snowmelt begin? To what degree will dust conditions advance an already potentially early melt season?

Stream gauge at Senator Beck Study Basin. The weir is under the ice on the left hand side of photograph. The staff gauge reads from the bottom of the weir notch. In early winter water continued to flow, freeze and accumulate to 1.6' on the staff gauge. We pick axed through 1' of ice to free the sensors and expose the stream underneath, which is flowing. The next step is to continue removing the ice so the sensors can be installed. This weir has been in place for 12 years and it is possible the structure and bed have morphed, so starting this summer we will gauge the stream to check accuracy of the weir and if need be develop a new stage/discharge relationship curve.
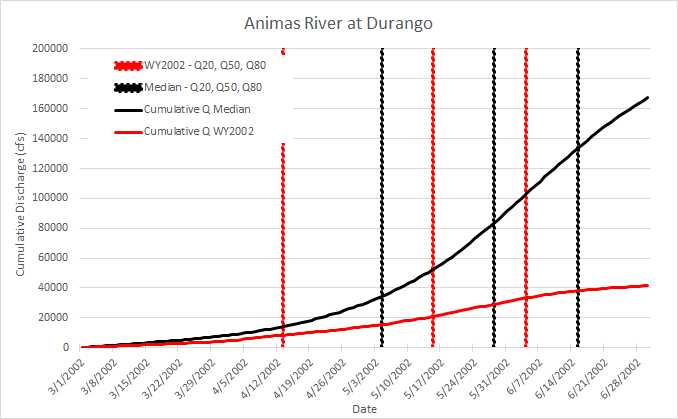
Streamflow timing indices were calculated based on cumulative flow from March 1 thru June 30, this time period captures the dominant snowmelt portion of the hydrograph for most rivers in Colorado. WY2002 was compared to the median for the San Juan, Animas, Rio Grande, Taylor, and Uncompahgre rivers. Indices calculated are Q20, Q50, and Q80, corresponding to 20%, 50%, and 80% of cumulative flow having passed the stream gauge. These values approximate the beginning, middle, and end of the snowmelt period. From left to right, the red and black vertical lines indicate Q20, Q50, Q80, respectively, for WY2002 (red) and the median (black)

From left to right, the red and black vertical lines indicate Q20, Q50, Q80, respectively, for WY2002 (red) and the median (black). Compared to the median, in WY2002 snowmelt runoff began a month early, but early season melt (# days from Q20 to Q50) was longer (38 days compared to the median of 27 days). Q50 occurred 17 days early compared to median. And Q80 was about 12 days early. In WY2002, Q20 to Q80 was 59 days, compared to the median of 43 days.

Snowmelt runoff began nearly 2 months early in the Rio Grande in WY2002, like the Uncompahgre runoff took place over a longer time-frame. Q50 was over 5 weeks earlier than the median. The bulk of snow melt streamflow was over before the month of June.

The San Juan was about a month early in seeing the start of snow melt runoff. The mid-point for WY2002 occurred when median Q20 typically begins. From Q20 to Q80 WY2002 was more compressed compared to the Rio Grande and Uncompahgre.
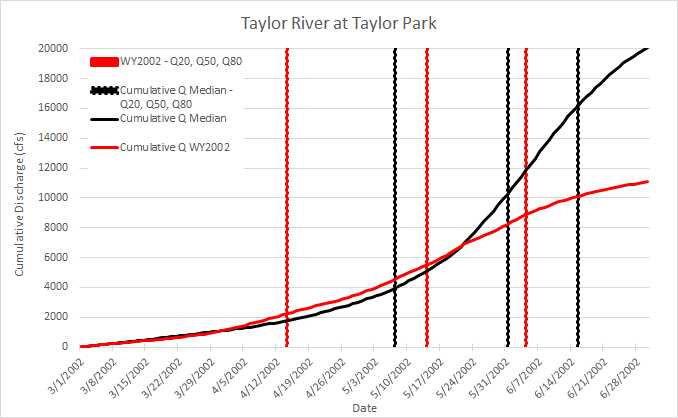
For the Taylor Q20 happened 3 weeks earlier than the norm. Q50 happened 15 days early. And the bulk of snowmelt runoff was completed by the first week of June.
Q20 began mid-April compared to the median of May 5. Q50 was about 15 days early, and the bulk of snowmelt runoff was completed the first week of June compared to the norm of mid-June.


