

Greetings from Silverton,
Dust and Snowpack Conditions:
Late in the evening on April 1 orange and hazy skies were observed in Crested Butte and Ouray. Along with observations at SASP, D3 was also observed at the surface around the Crested Butte area. The dust cameras in the source region showed a bit of haze as well. Yesterday and last night we saw windy conditions and a couple inches of snow last night in the Northern San Juans. If a small amount of additional dust came in April 1 it may be hard to decipher from D3. A snow profile at SASP on April 1 show signs of the snowpack warming and wetting. Streamflow at Senator Beck (stream gauge at 11,000') has kicked in a bit (stage has increased 0.10') more since April 1. We will assess dust conditions more closely today/tomorrow and issue another update soon.
April 1 Snow Course Plots:
Now that we have just passed into the month of April I thought it would be interesting to investigate how this season’s April 1st SWE compared within the context of long-term snow course SWE values. And I like to remind folks whenever I get the chance of the difference between snow course data and SNOTEL data. In Colorado, many snow courses were established in the 1930’s/40’s, a data record of ~80 years. Snow courses are manual measurements collected with a Federal Sampler which, by weighing the Sampler containing a core from the snowpack, directly translates to inches of water in that column of snow. Snow courses usually involve ~10-15 SWE measurements over a transect so the averaged SWE value that is reported contains at least some component of the spatial variability of the landscape. The downside of snow courses is they require a person to take these measurements (time, money, safety, etc). Due to lack of funding/resources at NRCS many snow courses have been “adopted” by water entities and private businesses, so instead of seeing these valuable long-term data records being abandoned, collect the data on behalf of the NRCS. Lastly, snow course data is usually only collected at the first of the month during the spring (low temporal resolution). Automated SNOTEL stations on the other hand report on a daily basis, so you can look at the data on the computer every morning and see how bad/good the snowpack is doing. But SNOTEL SWE data is point data, meaning the SWE value comes from a “pillow” that essentially weighs the overlaying mass of snow (no integration of spatial variability). SNOTEL stations collect other beneficial information like precipitation, air temperature, snow depth, wind speed/direction. Many SNOTEL stations were established near snow course sites to correlate data records. Now that many SNOTEL stations have been in place 30-40 years, the data seems to be used and referenced much more frequently than snow course data, but is important to consider the value of snow course data.
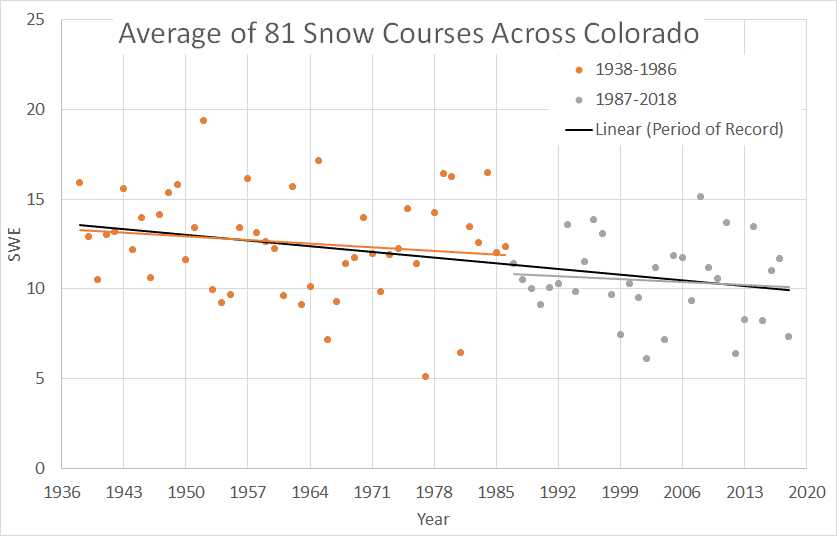
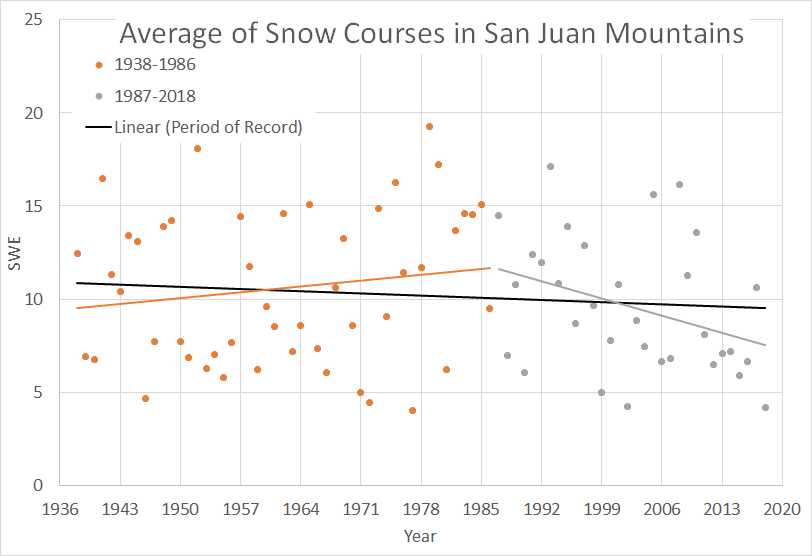
Above: Considering the plot "Average of 81 Snow Courses Across Colorado", WY2018 is comparable to 1966, 1981, 1999, 2004, 2012. We are faring just very slightly better than 1977 and 2002. Fewer snow course data comprised the averages in the 1930/40's, more snow courses were operational by the 1950's. The trend lines for the two different time periods was an arbitrary grouping, but intended to show the decline in SWE over the last ~ 30 years.
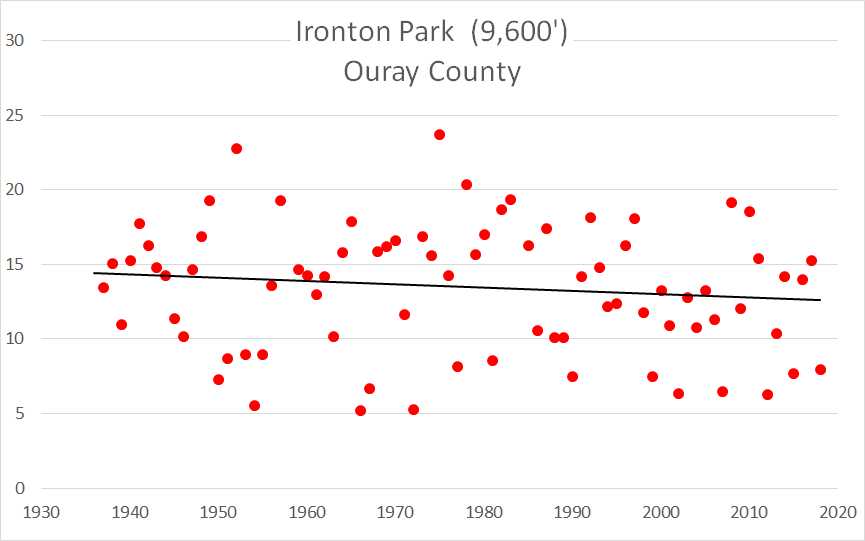
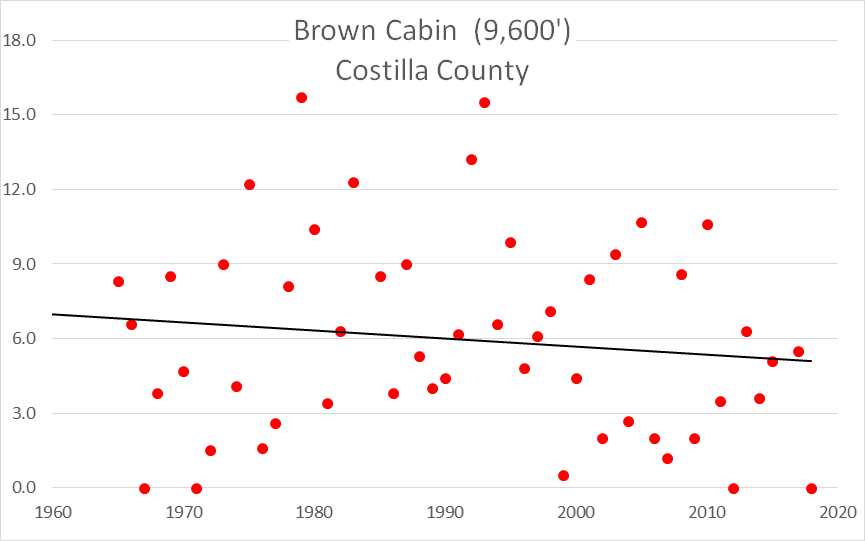
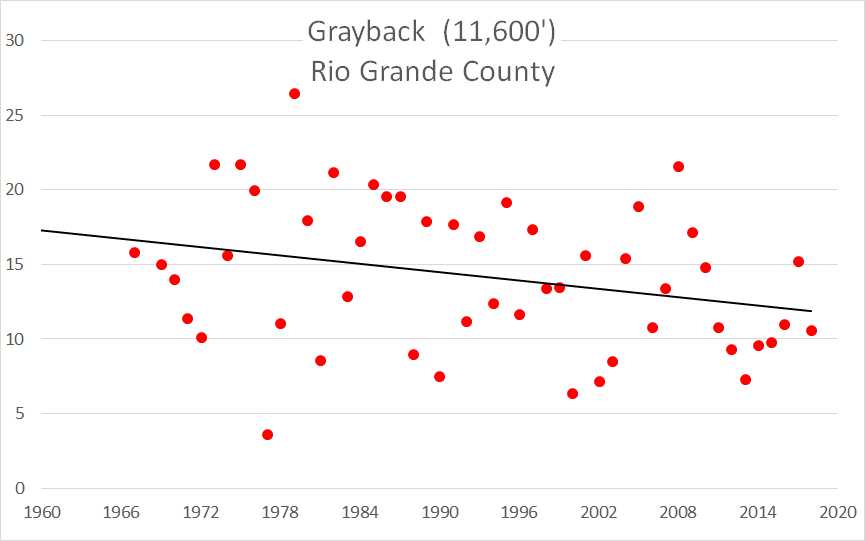
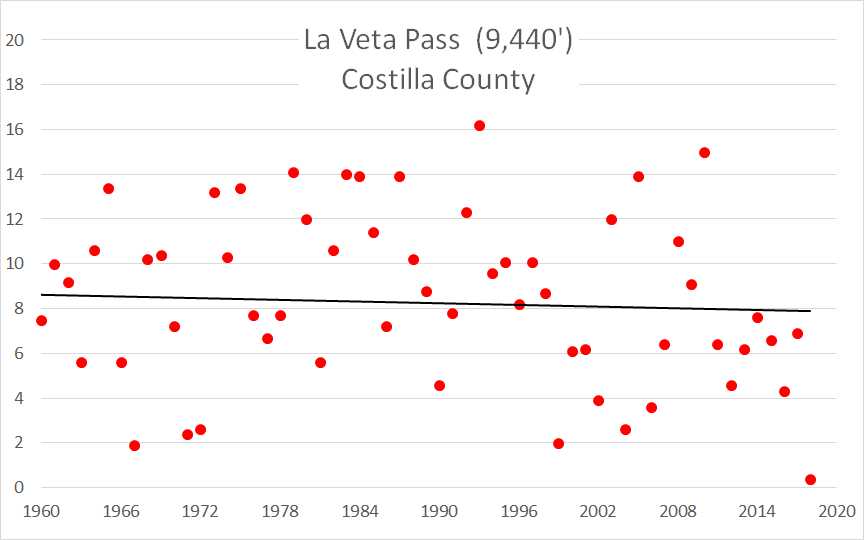
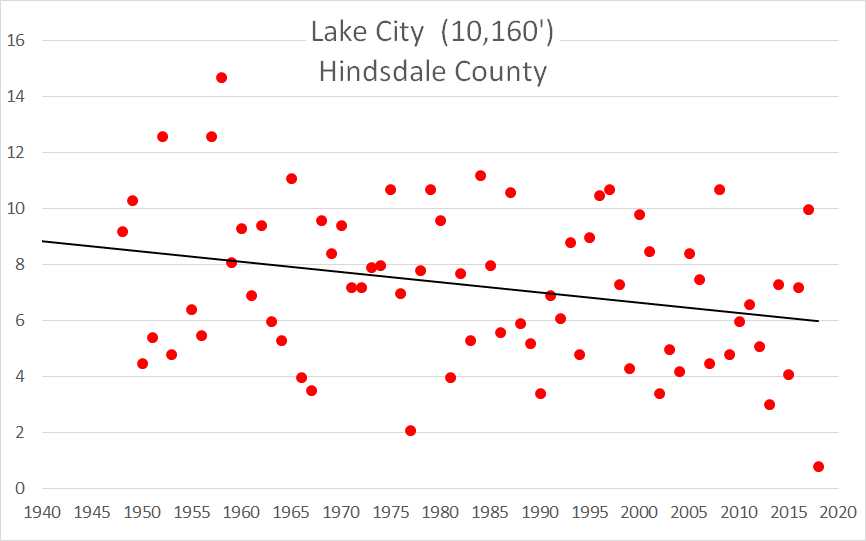
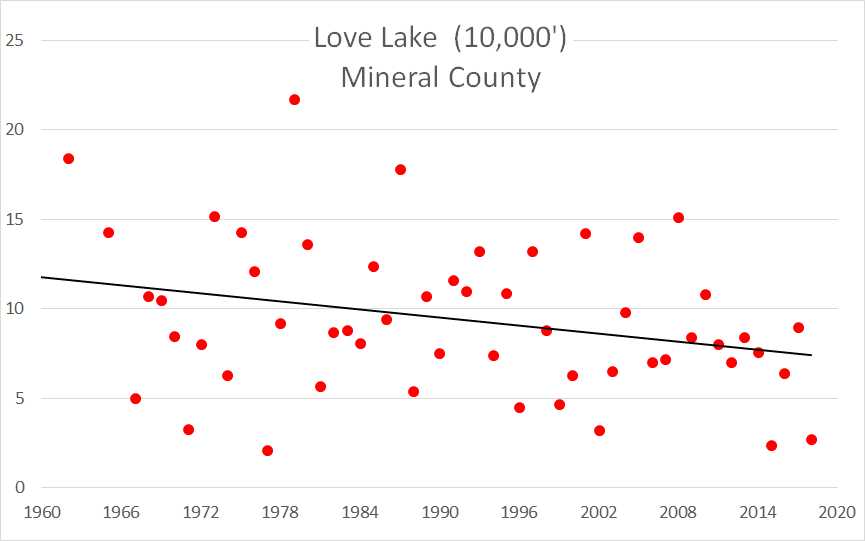
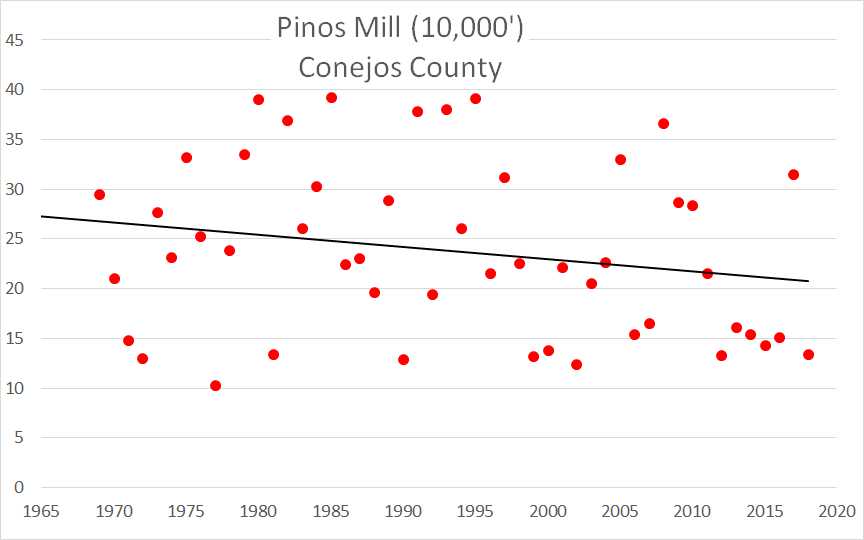
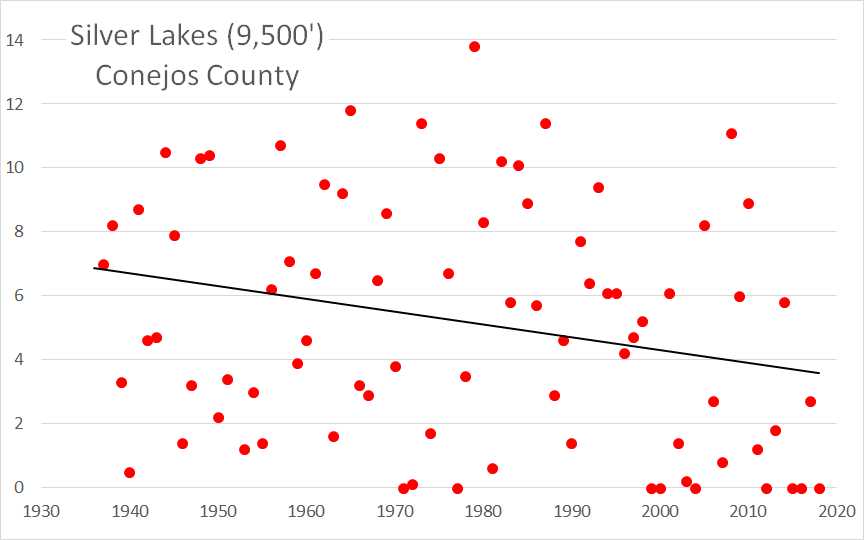
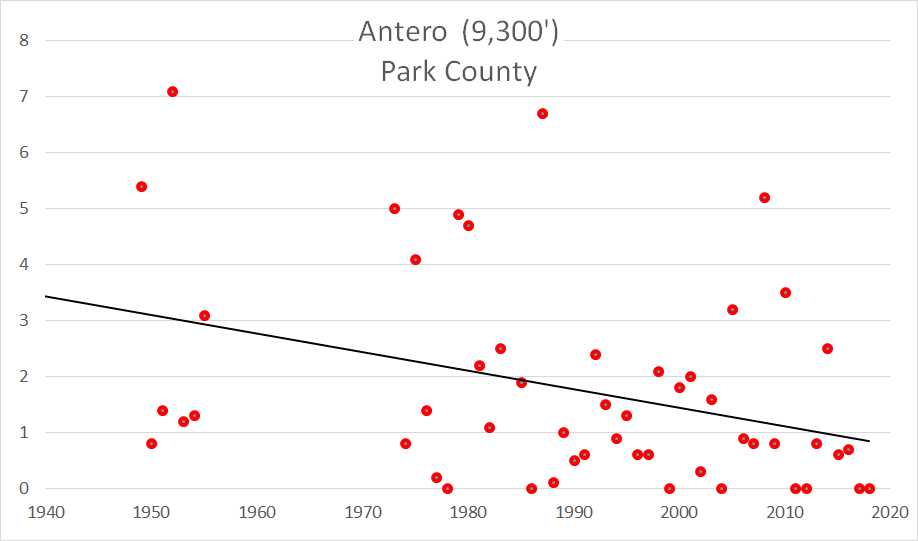
Above: This low snow season is hitting Southern Colorado the hardest. WY2018 conditions are very similar to 1977 and 2002, and are slightly less than 1946, 1971, 1972, and 1999 SWE values. Again, fewer snow course data comprised the averages in the 1930/40's, more snow courses were operational by the 1950's. The trend lines for the two different time periods was an arbitrary grouping, but intended to show the decline in SWE over the last ~ 30 years.

Above: Along with changes in SWE we see a change when peak SWE occurs by ~20 days. Julian day 90 is April 1. Peak SWE in the early 1980's occurred around April 10, recently it occurs around the last week of March.
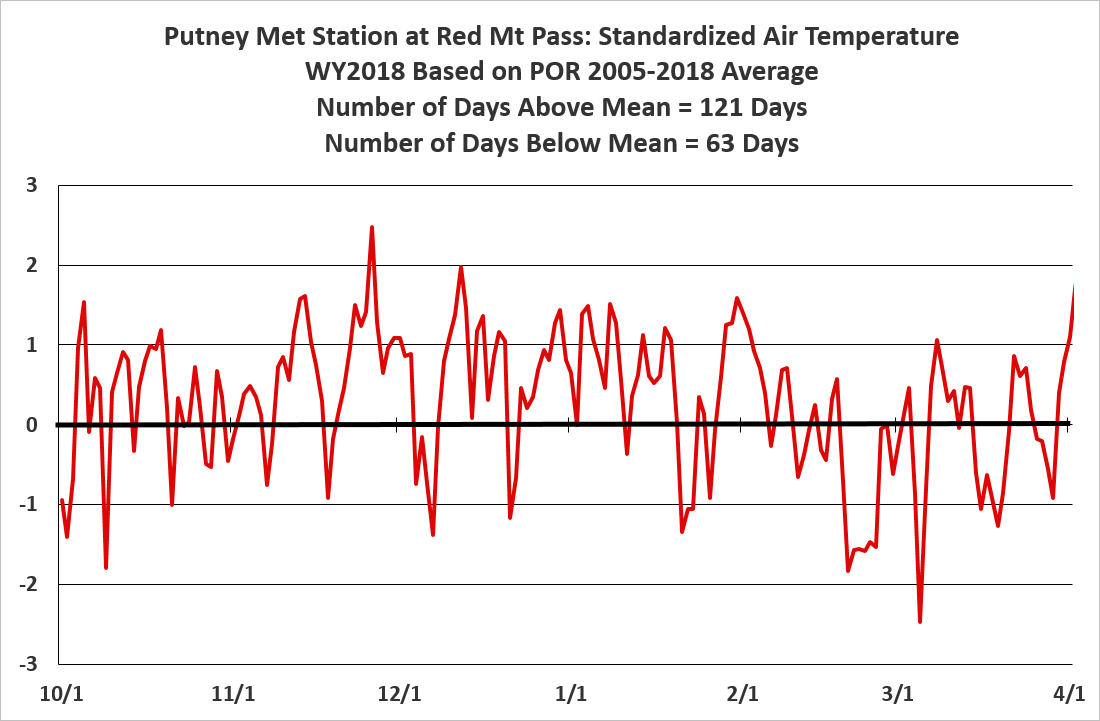
Above: This winter has been warm even based on our limited data record going back to 2005. Periods below the mean were short lived downward spikes.
HYDROCLIMATE TRENDS IN THE SAN JUANS
Discussing snowpack trends across the state of Colorado is a bit too much to take on in this Update. But a couple years ago, using the San Juan Mountains as the study area, my colleague Steven Fassnacht at CSU and I did a pretty simple analysis looking at air temperature and precipitation from three long-term climate stations as well as SNOTEL and snow course data across the San Juans in Colorado and New Mexico. Using the Regional Kendall Test for Trend we analyzed these variables for trends. If you live in the Rio Grande Basin I recommend reading a more recent analysis “Observed Changes in Climate and Streamflow on the Upper Rio Grande Basin” by U. New Mexico researchers.

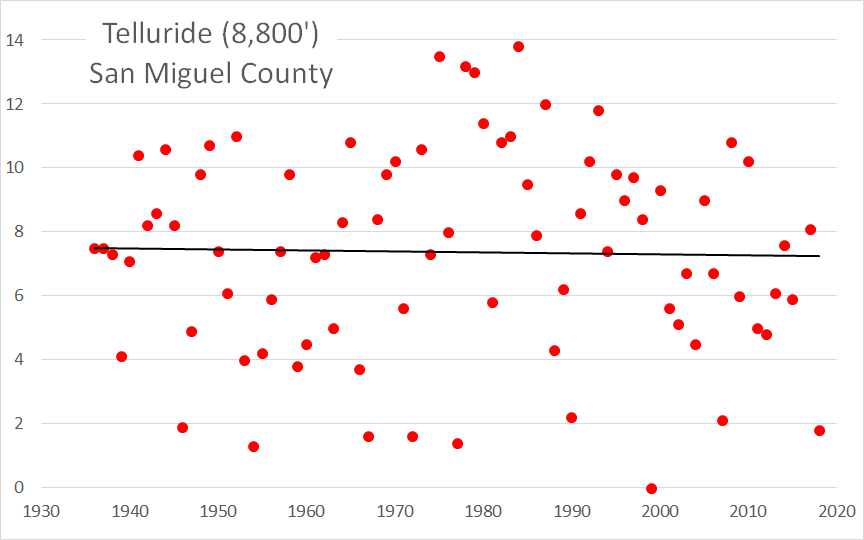
Above: Annual precipitation shows decreasing trend of 2.6” over period of record (1931-2015) at Hermit climate station. For the period 1980-2015 the decrease is significant. The entire decrease in precipitation is seen only during the cold season (Oct-May). Results are similar for Telluride (significant trend) and less so for Silverton (not significant) climate stations.

Above: Average annual, minimum, and maximum air temperatures for Hermit climate station (9,000’). Significant increase in average minimum, and average annual, temperatures. Average maximum temperature increased but not significantly. Approximately 1.5 degree Celsius warming in the last 35 years. Nearby Telluride and Silverton climate stations reveal similar rising minimum temperature trends.

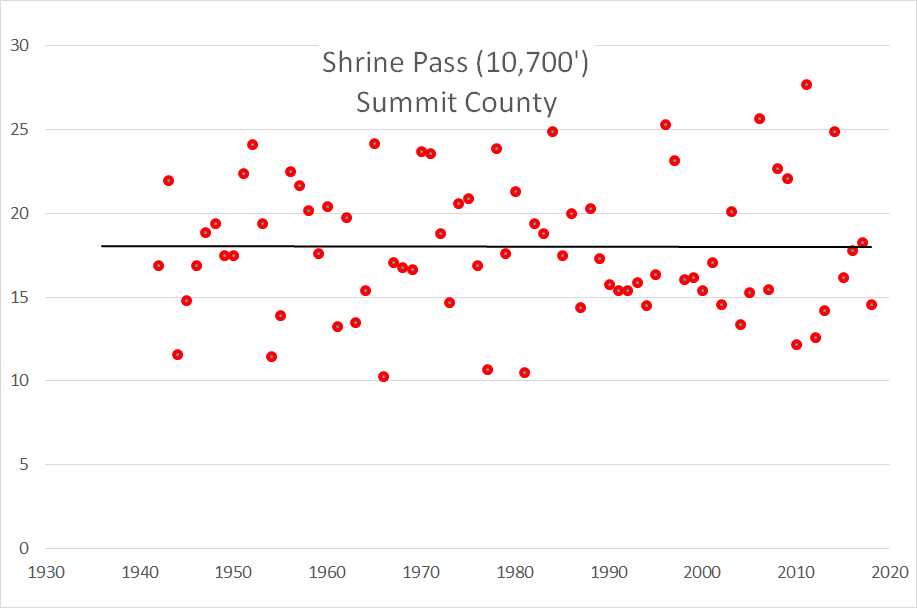
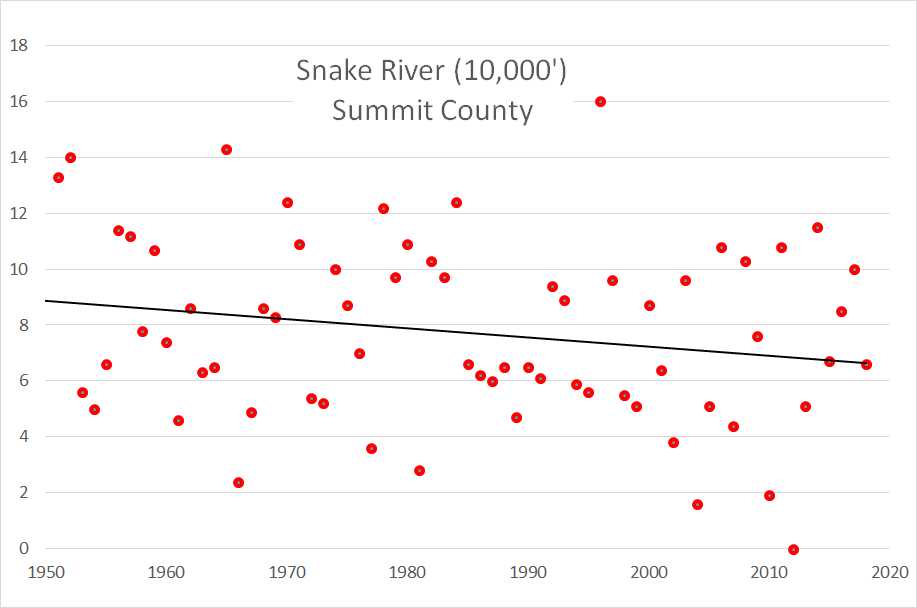
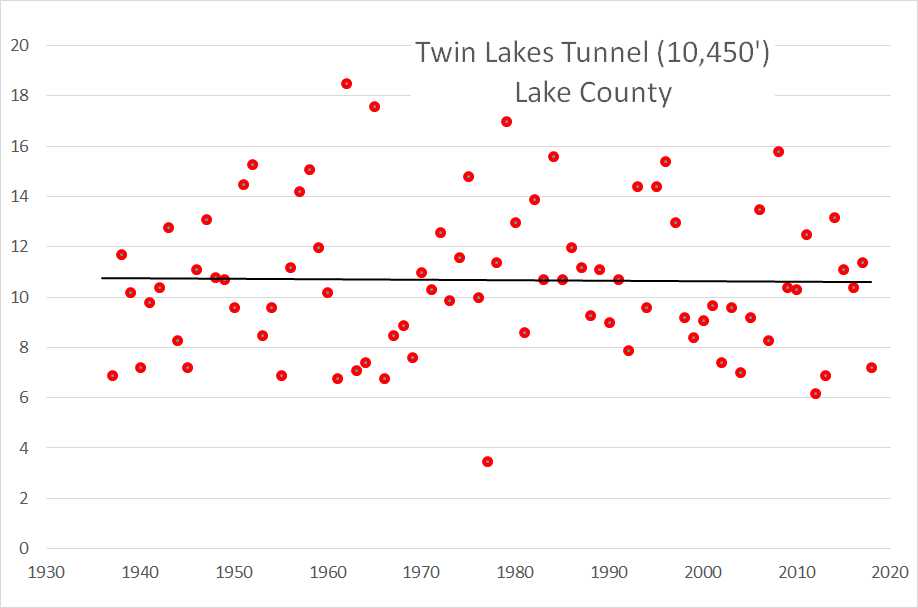
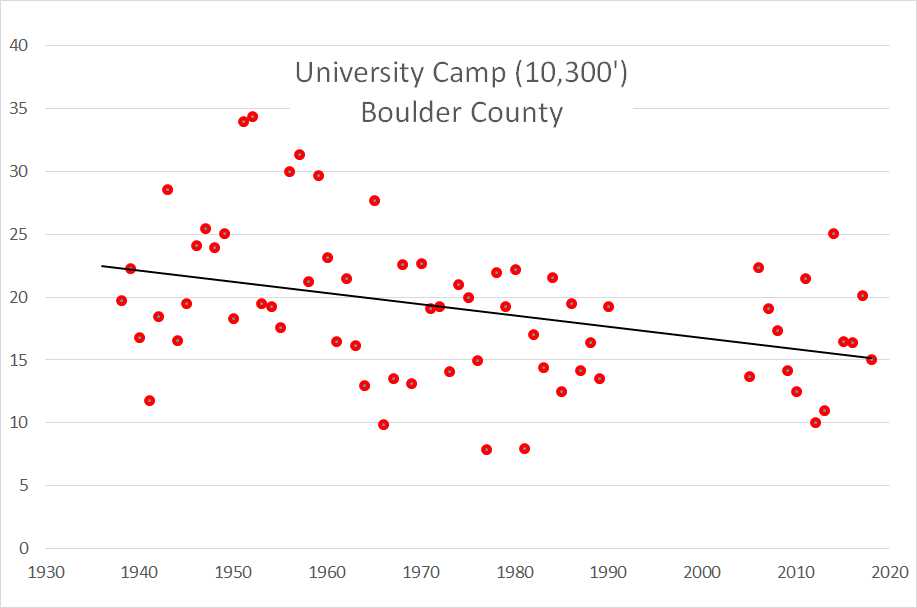
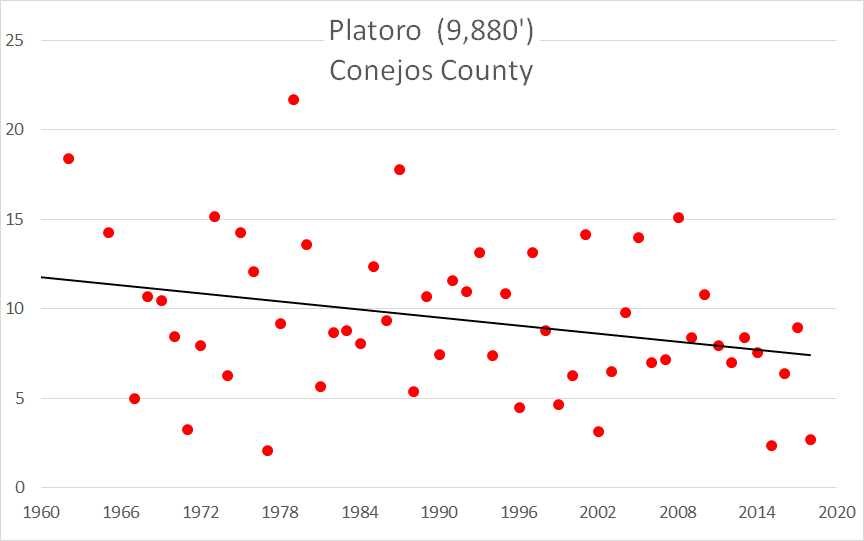
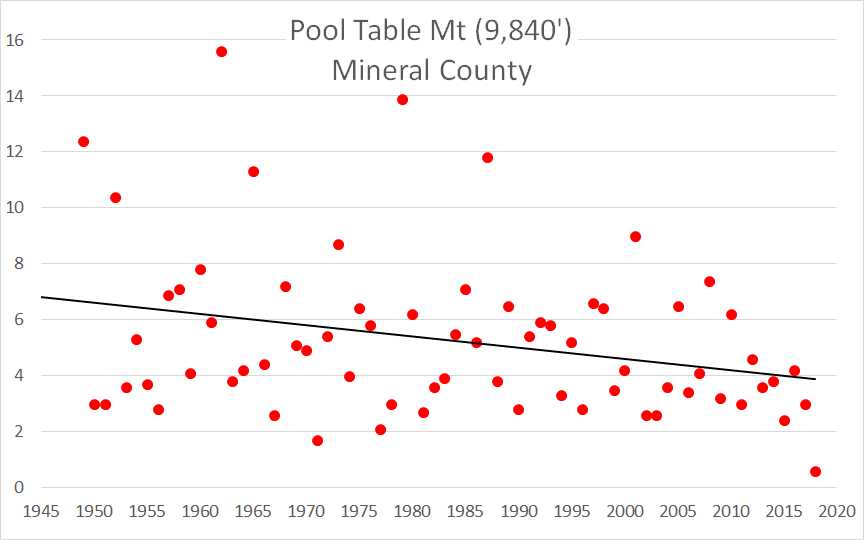
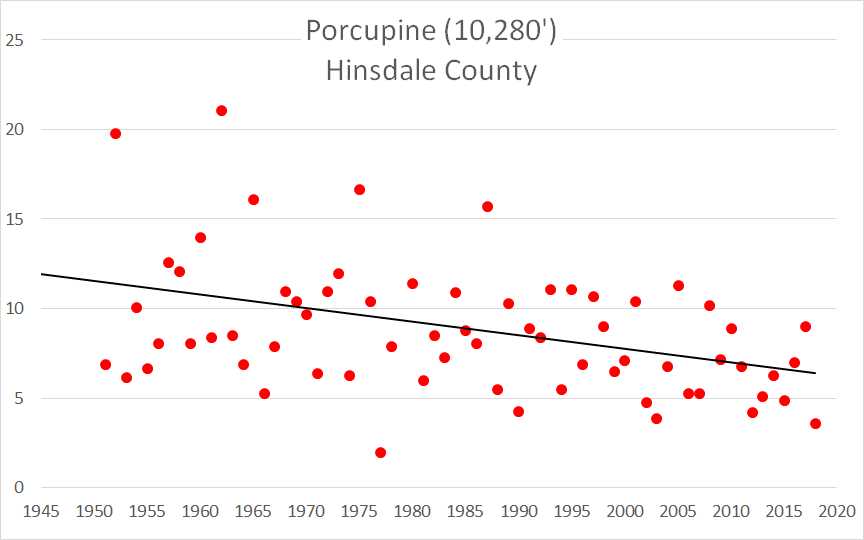
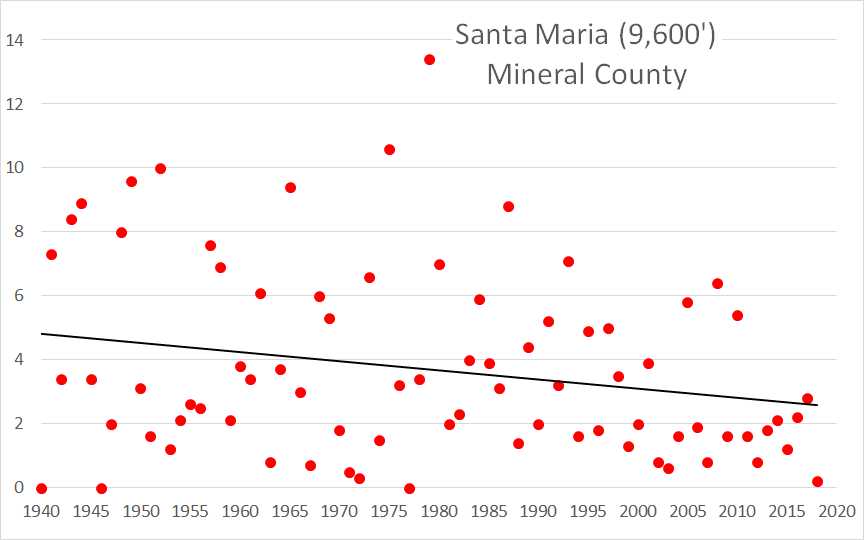
Above: Comparing two time periods, “early” (1982-1995) and “late” (2002-2015). Time periods were selected arbitrarily. April 1 SWE has decreased from the early to the later time series – significant for 2/3 of stations in study. 1982-2015 show a study region decrease of SWE of 5” for the 34 year period. Using both SNOTEL as well as snow course data both slopes agree in the relationship between the two time series. A similar analysis using the variable Peak SWE gave similar results. Locations with more SWE show an increased rate of decline of SWE.